Vue Error Tracking for Vite, Nuxt, SPAs | Self-Hosted
Self-hosted Vue error tracking for production interfaces
Capture errors from components, composables, routes, stores, API calls, and browser sessions on your own server.
$299 once, yours for life.
TL;DR: Telebugs accepts events from the official Sentry Vue SDK, supports sourcemaps and releases, groups related errors, sends useful notifications, and keeps your production error data on infrastructure you control.
A detailed error report for Vue error tracking captured by Telebugs.
Telebugs is one of the best software I bought this year. It made me save a lot of money I was spending on Sentry for all clients. Now I have everything I need in one place, and I paid for it just once :)
Vue production errors can come from components, composables, route transitions, Pinia or Vuex state, browser-only APIs, failed API calls, and code paths that only run for part of your audience.
Telebugs gives those errors a focused place to land. It runs on your server, accepts events from the official Sentry Vue SDK, and keeps the familiar SDK workflow without sending your error data to a hosted error-tracking SaaS.
Built-in sourcemap support helps production stack traces point back to your original Vue, JavaScript, and TypeScript files instead of stopping at bundled code.
You keep the parts that matter for debugging: grouped issues, backtraces, breadcrumbs, releases, notifications, notes, and retention controls.
Telebugs follows a no-nonsense philosophy. It gives Vue teams the core error tracking workflow: readable reports, grouping, releases, sourcemaps, notifications, notes, retention controls, and ownership of the server.
It is also predictable to budget for. Just $299 once.
Calculator estimates are manually maintained. This page was reviewed July 16, 2026; provider pricing changes often, so verify current pricing with each provider before budgeting. Sources: Sentry, BugSnag, Rollbar, Honeybadger, and Raygun.
That makes it a practical fit for Vue apps that can produce a lot of browser-side noise: lifecycle errors, failed API calls, stale chunks, route transition issues, store mutations, hydration issues, and regressions that only show up after a deploy.
Telebugs groups related Vue errors so you can focus on the issue, not on hundreds of duplicate events when one deploy affects many users.
Similar stack traces and messages are grouped together, which is useful when one broken composable, store mutation, failed fetch, or release regression appears across many sessions.
See the error grouping guide for details, including custom grouping and fingerprinting rules.
Grouped Vue errors in Telebugs for efficient error tracking.
Send Vue production errors to email, push, Slack, Discord, Microsoft Teams, or a webhook. Rules help you separate urgent new regressions from expected browser noise, repeated network failures, or low-priority issues.
Use notification rules to route component errors, route failures, and deploy regressions to the right people. Full details live in the notifications and rules guide.
Telebugs Vue error notifications for real-time error tracking.
Notification rules in a Telebugs Vue project for customized error monitoring.
Every captured Vue error includes a stack trace. When you upload sourcemaps, Telebugs can map production stack frames back to your original source files, so bundled code points back to the component, composable, store, or utility that actually failed.
That matters for Vue single-file components, TypeScript utilities, route guards, stores, and shared libraries where the useful frame is often hidden behind bundled output.
Vue exception stack trace example in Telebugs for effective error tracking.
Breadcrumbs can show the lead-up: console output, API calls, user interactions, route changes, emitted events, and custom app context from the Sentry Vue SDK.
Vue error breadcrumb example in Telebugs to enhance exception handling.
Vue apps can fail in places that are hard to reproduce locally. The code path may depend on a feature flag, a specific browser, stale cached assets, a route transition, a store state, or a third-party script that only runs in production.
Component and composable errors from render logic, lifecycle hooks, watchers, computed values, and emitted events.
Route and navigation errors from lazy-loaded chunks, guards, protected pages, and SPA transitions.
State and API errors from Pinia, Vuex, failed fetches, stale data, and unexpected response shapes.
Release regressions where a new bundle or sourcemap changes the stack trace, grouping, or affected users.
The stack trace tells you where the browser threw the error. The surrounding context tells you whether the issue affected a paying customer, a specific route, a rollout cohort, or everyone on a release.
Release and environment so production, staging, preview deploys, and canaries stay separated.
Route, component, and feature flag tags so recurring UI failures are easier to triage.
User, account, or tenant identifiers when they help support and engineering understand impact.
Browser, device, and locale context for client-side bugs that only happen in part of your audience.
Breadcrumbs for navigation, API calls, console output, emitted events, and custom app context.
Because Telebugs is self-hosted, you can capture useful debugging context while keeping control of privacy, retention, and sensitive-data scrubbing.
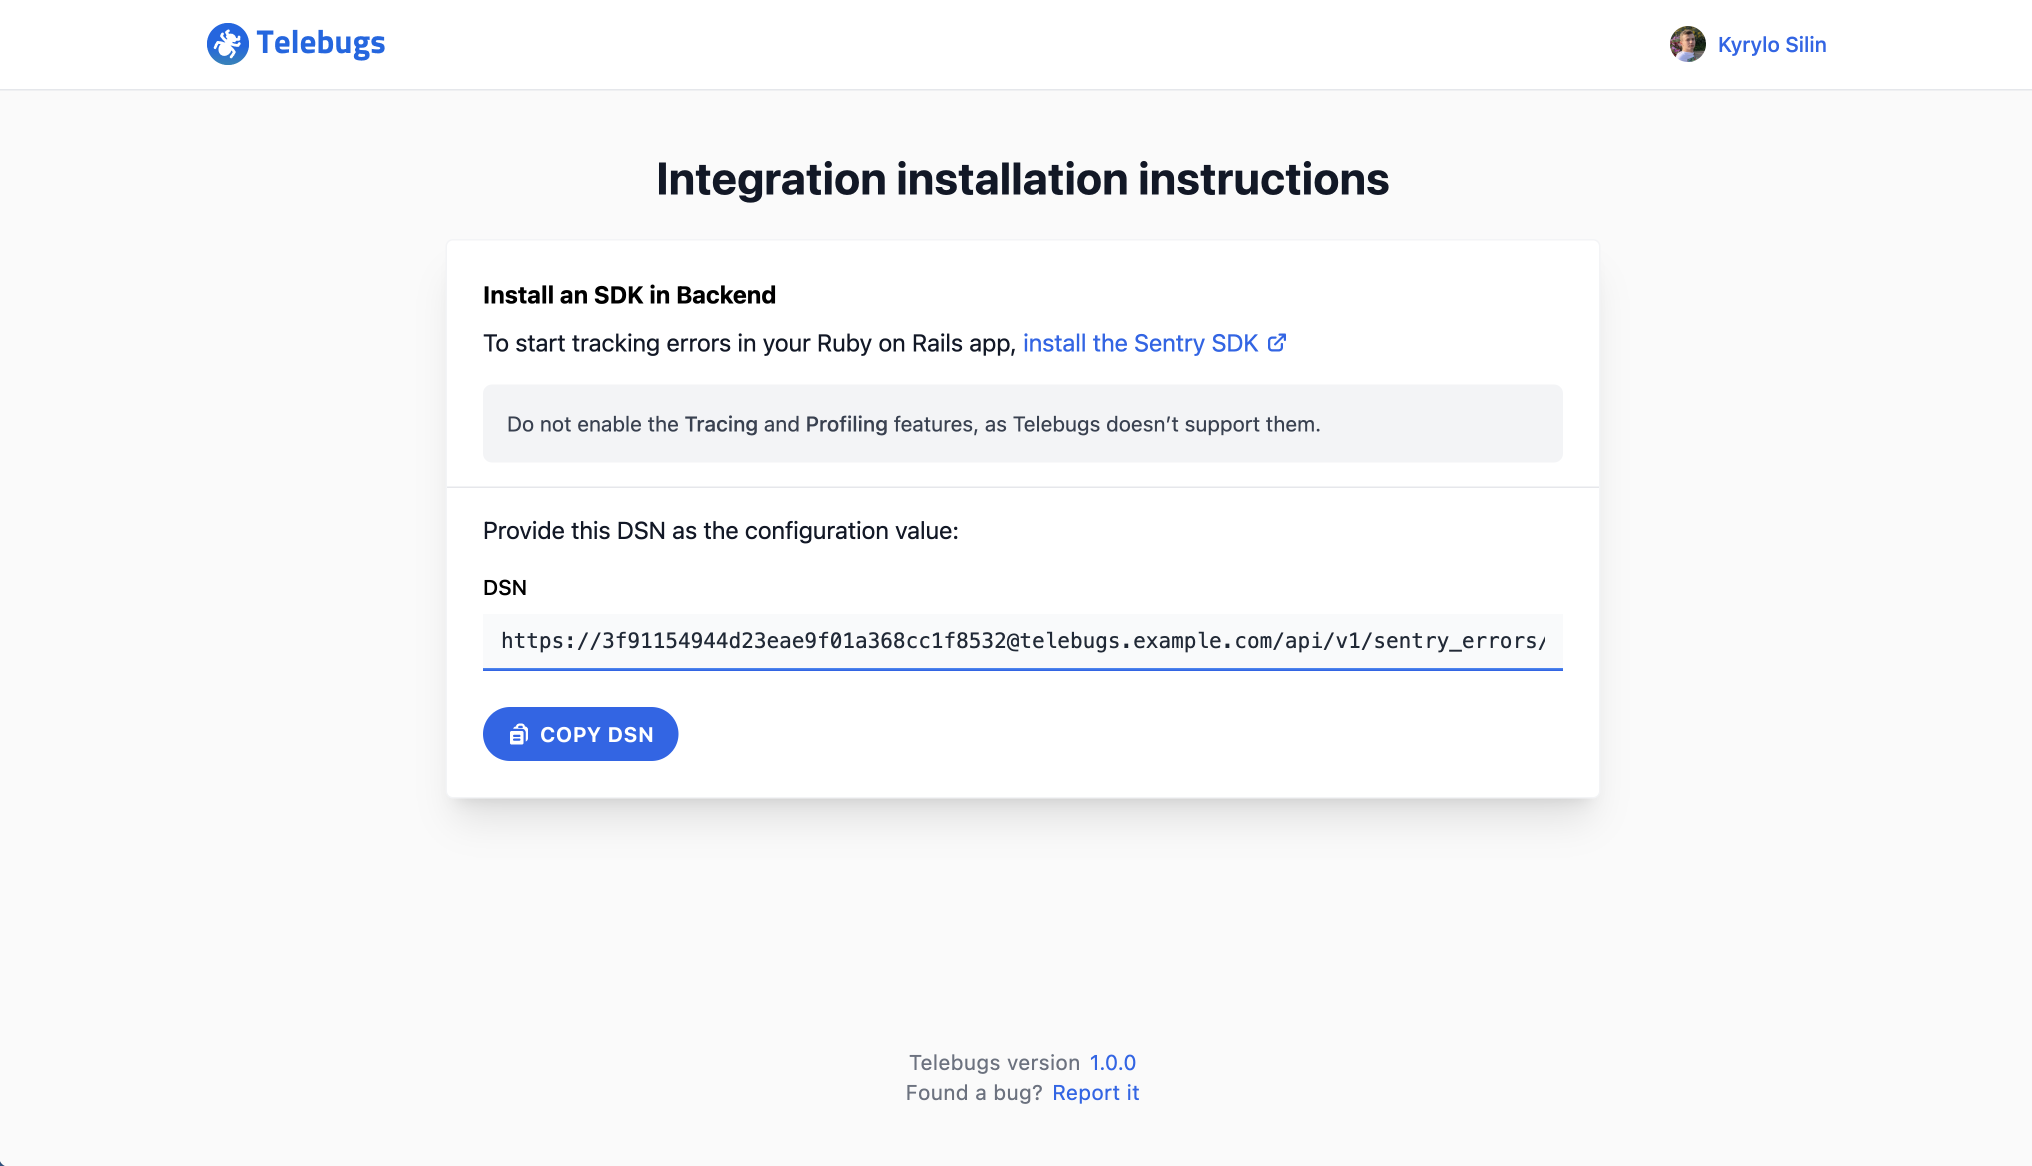
Getting Telebugs running for Vue errors does not require a large observability project. Install Telebugs on your server, create a project, copy the DSN, and initialize the Sentry Vue SDK in your app. The installation guide walks through the server side.
Once the server is running, Vue errors start flowing through the same SDK workflow many frontend teams already know from Sentry.
Worried about hosting your own? The docs cover setup, updates, supported platforms, notifications, releases, and retention.
Telebugs installation process for quick error tracking setup.
Events captured by the official Sentry Vue SDK are sent to Telebugs, where they can be grouped, searched, assigned, annotated, and linked to releases.
For additional configurations, refer to Sentry's Vue documentation. For sourcemaps and releases, see our dedicated guide. For the full picture across SDKs and languages, see our Sentry SDK compatible page.
Telebugs supports MCP, which makes it easier for AI tools that speak the Model Context Protocol to inspect error data without you copying stack traces by hand. For Vue teams, that can mean faster investigation of component traces, breadcrumbs, release metadata, sourcemaps, and affected routes.
The useful version of AI debugging is quiet and controlled: your source of truth stays in Telebugs, your sensitive data rules still apply, and an assistant can help reason about a production issue from the same structured context your team already captured. See MCP error tracking for the broader workflow.
Telebugs is compatible with the Vue versions and build setups supported by the official Sentry Vue SDK. It can be used with common Vue setups such as Vite, Vue CLI, custom bundlers, and single-page apps where the SDK is configured to send events.
Yes. Upload sourcemaps during your build or deploy process, and Telebugs can map minified production stack traces back to your original Vue, JavaScript, and TypeScript files.
Yes. Telebugs groups similar errors by default, and you can use custom grouping and fingerprinting rules when your Vue app needs a different issue boundary.
Yes. The Sentry Vue SDK can send breadcrumbs, tags, extras, user context, browser details, and route context to Telebugs, depending on how you configure it.
Yes. Telebugs MCP support lets compatible AI tools inspect structured error context from Telebugs, including Vue stack traces, breadcrumbs, release metadata, and event details, while keeping your server as the source of truth.
Use the Sentry SDK's client-side scrubbing options and Telebugs' server-side sensitive data scrubbing rules. Because Telebugs is self-hosted, you control where error data is stored and how long it is retained.
The setup process was smooth, and any questions we had were quickly addressed. Kyrylo’s dedication to customer support is outstanding. We’re now fully operational and excited to integrate Telebugs into our projects. It’s a pleasure to work with a developer who goes above and beyond to ensure everything works just right.
Marc Jakobs
ministry of code
Working with Kyrylo and Telebugs has been a real pleasure. One of my customers had a fairly complex setup with local DNS, strict firewall rules, and self-signed certificates, but everything was resolved quickly and with great care. Kyrylo responded fast, often within hours, and even released updates over the weekend. It’s rare to see that level of support and dedication. Telebugs is now in use across more than 20 projects and has become a valuable part of our workflow.