
I’ve just released Telebugs 1.3.0, which includes polishing and improvements to the error grouping feature. This release focuses on enhancing how errors are grouped, making it easier to manage and understand your error reports.
Custom fingerprinting
When Telebugs tracks errors in your application, it automatically groups them based on details like the error message or stack trace. Sometimes, this default grouping doesn’t fit your needs. Maybe you want errors with unique IDs grouped together, or organize them by specific features. Custom fingerprinting lets you take control and decide exactly how Telebugs groups your errors.
A fingerprint is simply a list of strings you provide when reporting an error. Errors sharing the same fingerprint end up in the same group, regardless of differing details. Here’s how you can use it in Ruby with Telebugs.
Basic fingerprinting
Suppose your app throws errors like:
Payment failed for order 123Payment failed for order 456
By default, Telebugs might treat these as separate issues because of different order numbers. With a custom fingerprint, you can group them together:
begin
  # Some code that might fail
rescue StandardError => e
  Sentry.capture_exception(e, fingerprint: ["payment-failure"])
end
Setting ["payment-failure"] as the fingerprint tells Telebugs to lump all errors with this fingerprint into one group, making it easier to track payment-related issues collectively.
Dynamic grouping
You can get more specific by including dynamic details in the fingerprint. For example, group errors by the user action, like "login" or "checkout":
begin
  # Some code that might fail
rescue StandardError => e
  action = "checkout" # This could come from your app’s context
  Sentry.capture_exception(e, fingerprint: ["error", action])
end
This creates separate groups for each action type. For example, ["error", "checkout"] for checkout errors and ["error", "login"] for login errors. This gives you a clearer picture of where problems occur.
Manual group merging
Sometimes, similar errors end up in separate groups due to minor differences. Manual group merging lets you combine these into a single group, keeping error tracking organized. Once merged, future reports matching either original group go into the new combined group.
For example, if you have two groups for a “Database Connection Failed” issue, one with a timeout message and another with a retry failure, you can merge them into a single group for easier management.
Here’s how it works:
- Go to the error group you want to keep as the main one.
-
Click the Merge button:
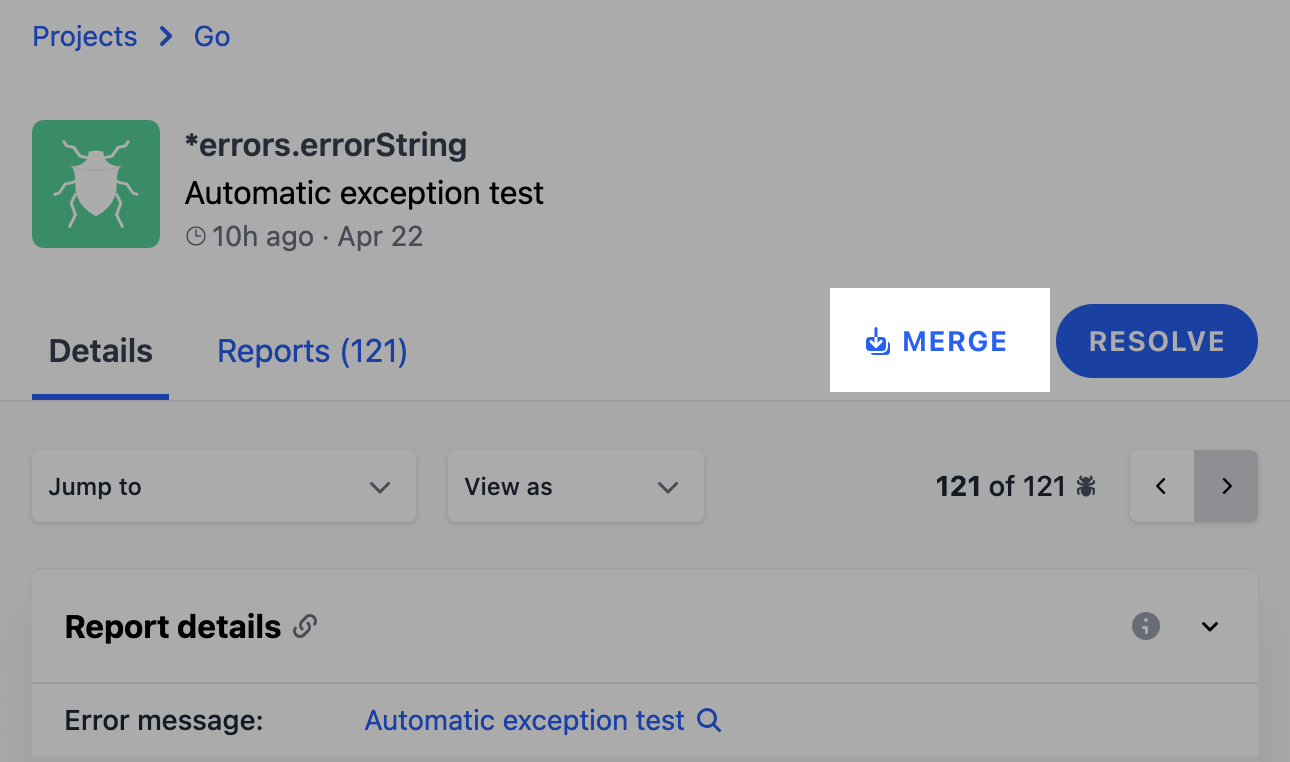
Merge button
-
A dialog opens with this text:
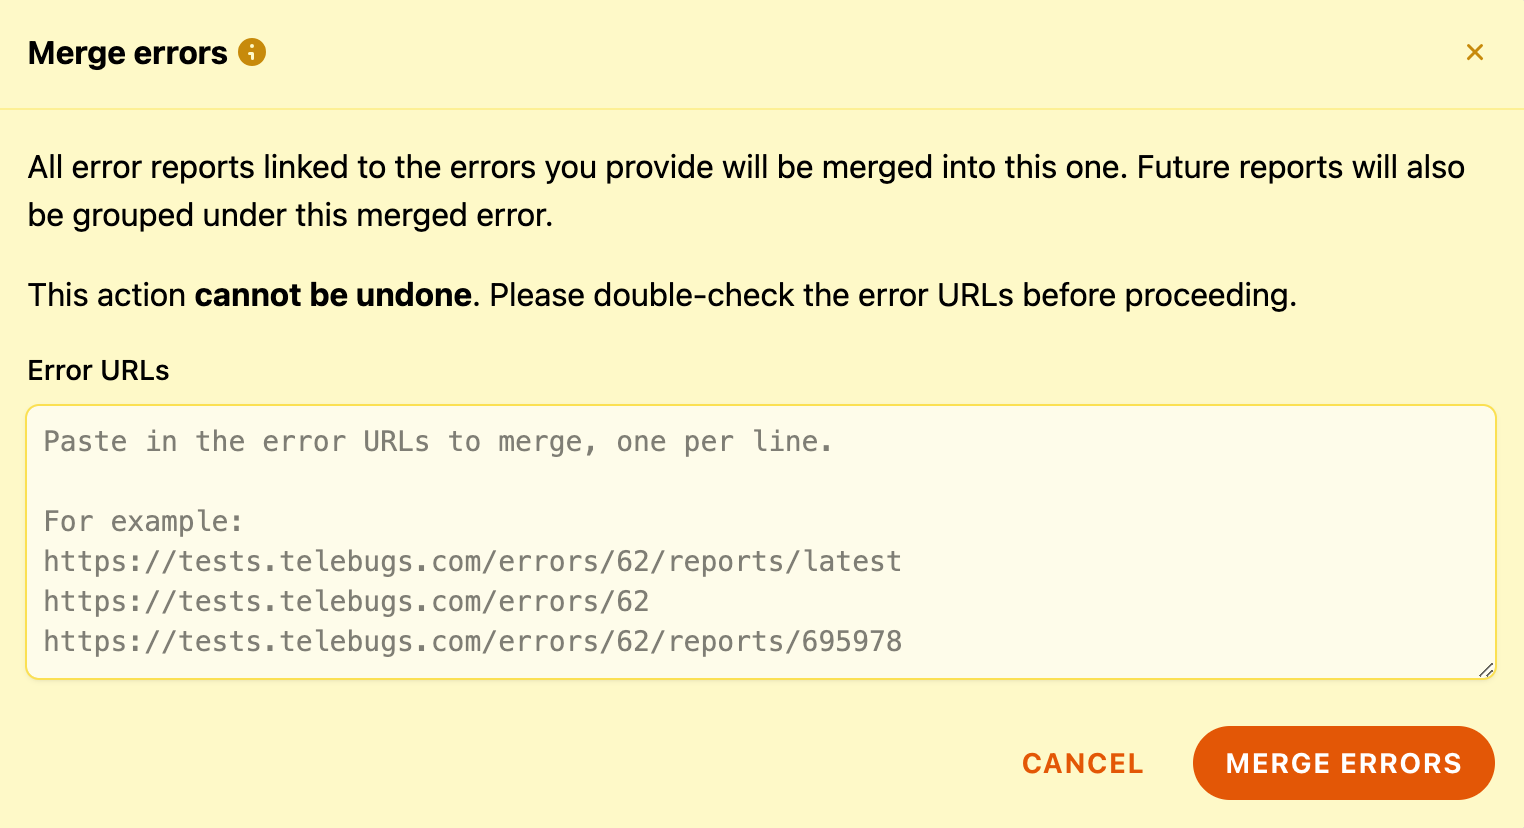
Merge errors dialog
- Enter the URLs of the error groups you want to merge into the main one.
- Press Merge Errors to confirm.


Since this action can’t be undone, double-check the URLs before confirming.
Grouping details in error reports
A standout update in Telebugs 1.3.0 is the addition of grouping details to error reports. This lets you see exactly why an error was grouped in a particular way, including the fingerprint used.
What you’ll see in grouping details
When you view an error report, you’ll see a new button that looks like a square stack.

Grouping details button in Telebugs
Clicking it reveals grouping details, which include:
-
Fingerprint: A unique identifier for the error group, e.g.
7bcb86ee6ce64c0a8d0f37fde2ff18c. - Method: The grouping method, such as “backtrace,” indicating the stack trace determined the grouping.
- Frames: The specific stack frames used for grouping, showing where the error occurred in your code (if applicable).
- Message: The error message that triggered grouping, e.g. “Database connection failed” (if applicable).
- Merged errors: If other groups were merged into this one, you’ll see their details, including their fingerprints.
Here’s an example of what you might find:

Grouping details example in Telebugs
This detailed view helps you confirm the grouping logic or adjust it if needed. It is especially useful when using custom fingerprints or merged errors.
Why it matters
With grouping details, you can:
- Pinpoint grouping issues: If an error is grouped unexpectedly, see why and adjust your fingerprint logic.
- Debug custom fingerprints: Verify that custom fingerprints work as intended.
- Track merges: View which error groups were combined and why, helping keep reports organized.
View As functionality
Telebugs 1.3.0 introduces the View as option in the error report view. It is a handy tool for developers who need to inspect raw error data. This lets you switch the display of error reports to JSON or XML formats, giving you a clear view of the underlying data structure.
Whether you’re debugging a tricky issue or prefer working with raw data, View as makes it easy to inspect exactly what’s sent to Telebugs. Here’s how:
- Open an error report in your Telebugs dashboard.
- Click the View as dropdown.
- Choose between JSON or XML formats.

View As dropdown in Telebugs
This feature is especially useful for verifying captured data or sharing detailed error information with external collaborators.
Conclusion
Telebugs 1.3.0 gives you more control and clarity over error tracking. With custom fingerprinting, manual group merging, and detailed grouping insights, managing errors has never been easier. The new View as option adds flexibility by letting you inspect error data in the format that works best for you.
Additionally, this release includes bug fixes and UI improvements. Examples include improved logging integration, resolved/unresolved error filters, and cleaner timestamps. These changes make your experience smoother. Under the hood, maintenance updates and CLI enhancements keep Telebugs running efficiently.
I hope these updates help you tackle errors more effectively. As always, your feedback is welcome. Feel free to reach out with any thoughts or suggestions. Thanks for using Telebugs, and happy debugging!
Kyrylo