The Telebugs Manual 
Welcome to the official Telebugs manual. This guide will teach you how to set up and use Telebugs, a refreshingly simple and self-hosted error tracking tool compatible with the Sentry SDKs.
This manual (Telebugs) is available in multiple formats:
- HTML - entirely on one page.
- HTML - with one page per node.
- ASCII Text.
Table of Contents
- 1 Welcome to Telebugs
- 2 Telebugs philosophy
- 3 How the sausage is made
- 4 Installation
- 5 First launch
- 6 Creating your project
- 7 Sending your first error report
- 8 Team management
- 9 Account settings
- 10 Notifications
- 11 Projects
- 12 Apps
- 13 Releases
- 14 Source maps
- 15 Error reports
- 16 Data retention
- 17 Service Messages
- Appendix A Software License Agreement
- Appendix B
telebugscommand reference - Appendix C Supported platforms
- Appendix D Installing on DigitalOcean
- Appendix E Installing on Hetzner
1 Welcome to Telebugs 
Thank you for choosing Telebugs!
Telebugs is a refreshingly simple error tracking tool designed to help you catch and fix production errors in real-time. Whether you’re building web apps, mobile apps, embedded systems, or games, Telebugs ensures you stay on top of issues before they impact your users.
It’s fully compatible with Sentry SDKs, meaning it works seamlessly with a wide range of languages and frameworks right out of the box.
Unlike cloud-based error tracking services, Telebugs is self-hosted — so you own your data, with no restrictions on the number of errors, projects, or team members. Track as much as you want, invite as many collaborators as you need, and maintain complete control over your infrastructure.
This manual will walk you through setting up Telebugs and making the most of its features.
Let’s get started on making your software more reliable than ever!
2 Telebugs philosophy 
Telebugs adheres strictly to its guiding principles, which emphasize simplicity, security, and user control in error tracking. This approach addresses common challenges in modern software tools, where SaaS providers often impose escalating costs for basic functionality.
At the heart of Telebugs lies a simple idea: error tracking should be straightforward, secure, and entirely under your control. The Telebugs philosophy shapes every aspect of it, from its design to its deployment, ensuring it empowers developers without getting in their way.
Telebugs pillars 
Telebugs is built on the following pillars.
I: Less is more 
Error tracking shouldn’t require complex setups or steep learning curves. Telebugs is deliberately designed to be simple. Simple to install, simple to use, and simple to maintain. The less is more principle is reflected at each level of Telebugs.
II: Be boring 
The goal of Telebugs is not to impress you — it’s to perform reliably.
Why? Because reliable tools quietly do the job without fanfare. Have you ever
been excited about cd’ing into a directory? That’s the level of
dependability Telebugs aims to achieve.
III: Own your data 
Software giants try to scare you into thinking that as soon as you save a file on disk, it evaporates the next instant unless it’s replicated, backed up, and prayed upon. This is true. To some degree. And that degree is what they disproportionately exploit and artificially inflate. Yes, you need to do backups, but it’s not as scary or complex as it seems. You can do it without a sysadmin.
IV: Freedom to scale 
You don’t need Kubernetes to run Telebugs (although some Telebugs users still do it). You can start on the cheapest Hetzner VPS and scale up your instance as you go. Telebugs won’t scale infinitely, but it will cover the majority of your needs for the entire lifecycle of most indie and medium business projects.
V: Finished software 
Telebugs strives to become
finished
software. Imagine if cd required an account? Atrocious. How could it
even end up like that? Well, that’s what inevitably happens with all
software. It grows and grows indefinitely, adding more features (asked
for or not), and once the board realizes there’s not much left to add,
they might even allow you to cd with a guest account. This is not
Telebugs.
3 How the sausage is made 
Telebugs is built with proven and reliable technologies. Understanding the underlying stack is valuable because when you purchase Telebugs, you also get its full source code that you will own for life. You can even modify the source code however you want (as long as you don’t share it, because Telebugs is not open source (See Software License Agreement)).
Telebugs is built with the following technologies:
- Ruby on Rails: A Ruby web framework with decades of reputation. Simple and boring. We don’t need a revolution here.
- Turbo: An umbrella term for a set of technologies that power all modern Rails apps by default. Telebugs doesn’t use JavaScript frameworks thanks to this (and the next item). It’s a simple and proven technology that is easy to use and maintain.
- Stimulus: Think of it as jQuery for 2025, but simpler (because JavaScript has become much better).
- Solid Queue: Processes background jobs like sending error notifications. This secret sauce lets Telebugs stay Redis-free, which means fewer dependencies to manage.
- SQLite: Undoubtedly, the MVP of this stack. A fantastic library that needs no introduction and minimal administration.
That’s all! Error processing can be that simple!
So is it just for Rails devs? No! You don’t have to modify the code or even touch it at all. You can read it, of course. It’s all pure Ruby, probably the most programmer-friendly syntax to read. It almost reads like English.
And if you’re not familiar with it, just pair up with an LLM of your choice and vibe code your way. That said, I don’t expect you to do that because Telebugs aims to ship all the necessities.
Telebugs isn’t trying to change the world. It’s trying to leave you alone — and that’s the point.
4 Installation 
Since Telebugs is self-hosted, you’ll need to have a few things ready before getting started:
- Your own domain name (e.g., example.com or telebugs.example.com).
- A machine connected to the internet.
- Basic tech skills (familiarity with SSH and terminal commands).
Note: New to self-hosting? Don’t worry — the installer handles everything for you: Docker installation, configuration, and even the TLS certificate. Just run a single command, sit back, and sip a cup of tea.
4.1 System requirements 
Telebugs can run on nearly any hardware, including a VPS, cloud server, home
server, or even a Raspberry Pi. It supports
both AMD64 (also known as x86-64, x64, x86_64, and
Intel 64) and ARM64 (also known as AArch64) architectures. In
general, if Docker can run on it, Telebugs can too.
Supported platforms 
Telebugs is compatible with over 100 programming languages and frameworks through Sentry SDKs, including popular choices like JavaScript (Node.js, React, Angular), Python (Django, Flask), Ruby (Rails), Java (Spring), PHP (Laravel), .NET (ASP.NET Core), and Go. For a complete list of supported platforms, see Supported platforms.
Error throughput 
When deciding how powerful your machine needs to be, consider the following table:
| CPU | Est. max errors/second | Est. max errors/day |
|---|---|---|
| 2 | 30 | 2,592,000 |
| 4 | 60 | 5,184,000 |
| 8 | 120 | 10,368,000 |
| 16 | 240 | 20,736,000 |
Throughput depends on your machine’s CPU and RAM. The table above provides rough estimates of how many errors Telebugs can handle per second and per day, based on the number of CPU cores. These figures are approximate and may vary depending on your setup, application complexity, and error volume.
Throughput is shared across all projects in a Telebugs installation. If you run multiple projects, each one gets a fraction of the total. For example, with two projects, each gets half; with four, each gets a quarter, and so on.
Recommended minimum specs 
- RAM: 1 GB
- Disk space: 40 GB
- CPU: 1
Recommended specs for small to medium projects 
- RAM: 4 GB
- Disk space: 80 GB
- CPU: 3
Operating system compatibility 
- Telebugs is tested on Linux (Ubuntu, Debian, Alpine, Rocky), and should work on any OS that supports Docker.
- macOS
4.2 Installation steps 
The whole process takes less than 10 minutes. Here’s how to get started:
- Choose a server: Select a machine to host Telebugs (cloud or local). I recommend DigitalOcean (setup guide) or Hetzner (setup guide).
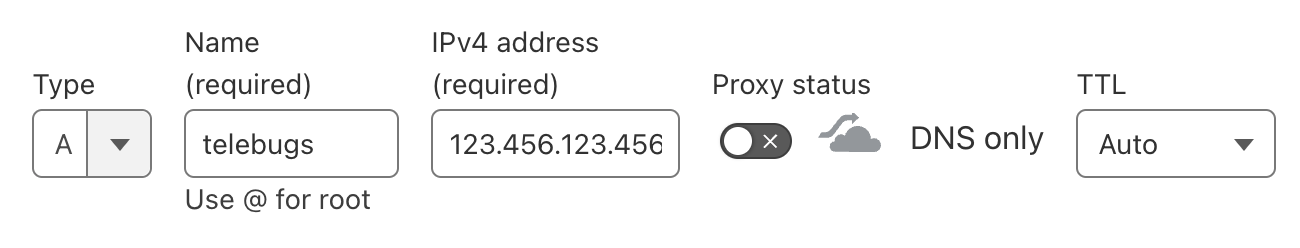
- Point your domain: Update your DNS to link your domain to your
server’s IP address. Ensure it’s a direct DNS record (no proxying — Telebugs
handles TLS).
- Connect to your server: Use SSH or your provider’s console to access the server.
- Run the installation command: Copy the command from your email and
run it in your server’s terminal. The installation process may take up to 5
minutes.
Your personalized installation command will be similar to the following:
bash -c "$(curl -fsSL https://auth.telebugs.com/install/a12b-c34d-e56f-g78h)"
IMPORTANT: Keep your install command private — don’t share it with anyone or post it online. It’s uniquely linked to your account, and the license is tied to you. Your personal purchase token is included in the email you received after downloading Telebugs.
When you run this command, it will automatically install Docker on your server (assuming you’re using Linux, which is standard for most cloud environments). It will then download the latest version of the Telebugs app as a Docker container. During setup, you’ll be prompted to enter your domain name so we can generate a TLS certificate for you.
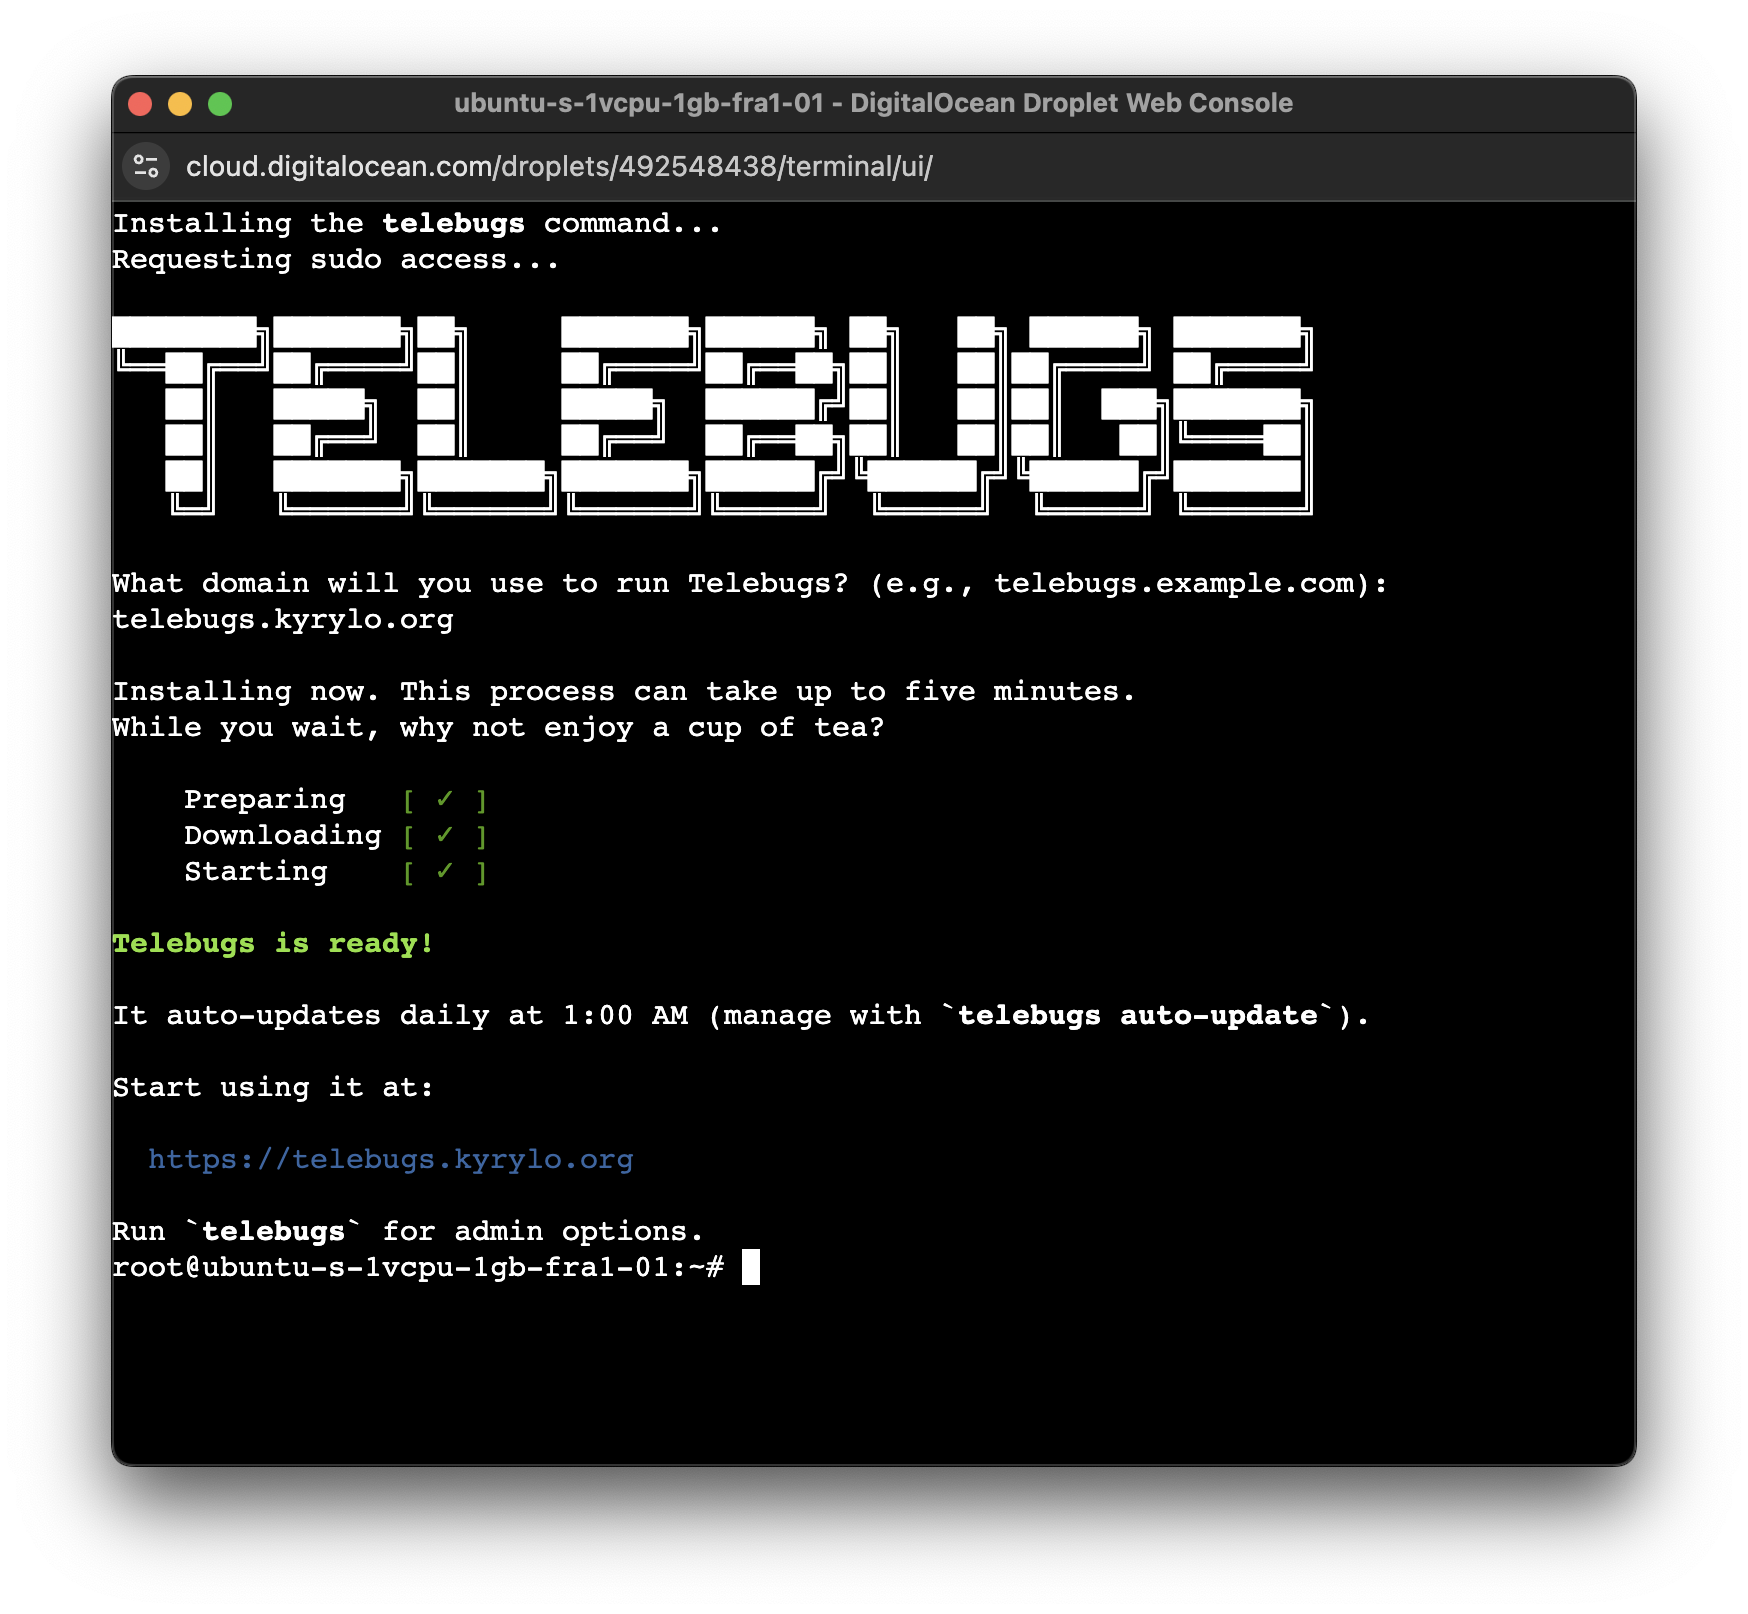
That’s it! You’re now ready to set up the first user on your new
Telebugs installation. Just visit https://YOUR-DOMAIN in your
browser to get started. After that, you can begin inviting the rest of
your team.
Telebugs will automatically update itself to the latest version every
night at 1 AM (based on your server’s local time). You can disable this,
or perform other admin tasks — like backing up data, resetting
passwords, and more — using the telebugs command. Simply connect
to your server and run telebugs to see all available options.
Enjoy error tracking with Telebugs!
P.S. Planning to run multiple Telebugs installations? You’ll need a separate license for each domain.
4.3 Custom TLS certificates 
Telebugs automatically generates and installs a TLS certificate for you using Let’s Encrypt. If you already have a TLS certificate for your domain, you can use it instead.
4.3.1 TLS termination with Nginx 
Nginx is the recommended way to serve Telebugs over
HTTPS when using your own TLS certificate. It acts as a reverse proxy, handling
TLS termination and forwarding requests to the Telebugs app running in a Docker
container.
When prompted to enter your domain during the telebugs setup command,
leave it empty and press Enter. This configures Telebugs to run
on http://localhost:5555 without TLS, allowing Nginx to manage the
certificate.
- Install Nginx:
apt-get update
apt-get install nginx
- Configure nginx. Create a configuration file at
/etc/nginx/sites-available/telebugs
server { listen 443 ssl; server_name <YOUR_DOMAIN>; ssl_certificate /path/to/your/fullchain.pem; ssl_certificate_key /path/to/your/privkey.pem; location / { proxy_pass http://localhost:5555; # Forward to Docker container proxy_set_header Host $host; proxy_set_header X-Real-IP $remote_addr; proxy_set_header X-Forwarded-For $proxy_add_x_forwarded_for; proxy_set_header X-Forwarded-Proto $scheme; } } server { listen 80; server_name <YOUR_DOMAIN>; return 301 https://$host$request_uri; # Redirect HTTP to HTTPS } - Link the configuration file to the sites-enabled directory to activate it:
ln -s /etc/nginx/sites-available/telebugs /etc/nginx/sites-enabled/
- Test the configuration and restart Nginx:
nginx -t
systemctl restart nginx
Once completed, Nginx will handle your custom certificate and securely forward traffic to Telebugs on http://localhost:5555. This setup gives you the flexibility to use your preferred TLS certificates.
4.3.2 TLS termination with HAProxy 
HAProxy is another option for serving Telebugs
over HTTPS with your own TLS certificate. It can also act as a reverse proxy,
similar to Nginx.
When prompted to enter your domain during the telebugs setup command,
leave it empty and press Enter. This configures Telebugs to run
on http://localhost:5555 without TLS, allowing HAProxy to manage the
certificate.
- Install HAProxy:
apt-get update
apt-get install haproxy
- Configure HAProxy. Edit the configuration file at
/etc/haproxy/haproxy.cfg and add the following lines:
frontend https_frontend
  bind *:443 ssl crt /path/to/your/certificate.pem
  mode http
  option httplog
  default_backend telebugs_backend
backend telebugs_backend
  mode http
  server telebugs_server localhost:5555 check
  option http-server-close
  http-request set-header X-Forwarded-Proto https
  http-request set-header X-Forwarded-For %[src]
  http-request set-header X-Forwarded-Host %[req.hdr(Host)]
  http-request set-header X-Real-IP %[src]
Note: The certificate.pem file should contain your TLS certificate and private key concatenated together. If you’re using Let’s Encrypt, you can concatenate them like this:
cat fullchain.pem privkey.pem > /etc/ssl/private/certificate.pem
- Test the configuration and restart HAProxy:
haproxy -c -f /etc/haproxy/haproxy.cfg
systemctl restart haproxy
Once completed, HAProxy will handle your custom certificate and securely forward traffic to Telebugs on http://localhost:5555. This setup gives you the flexibility to use your preferred TLS certificates.
4.4 Kubernetes installation 
Telebugs can be installed on a Kubernetes cluster using the official Helm chart. This allows you to deploy Telebugs in a containerized environment, making it easy to manage and scale.
This is not a beginner-friendly option, so it’s recommended only if you already have experience with Kubernetes and Helm. The recommended way to install Telebugs is by following the Installation instructions above.
5 First launch 
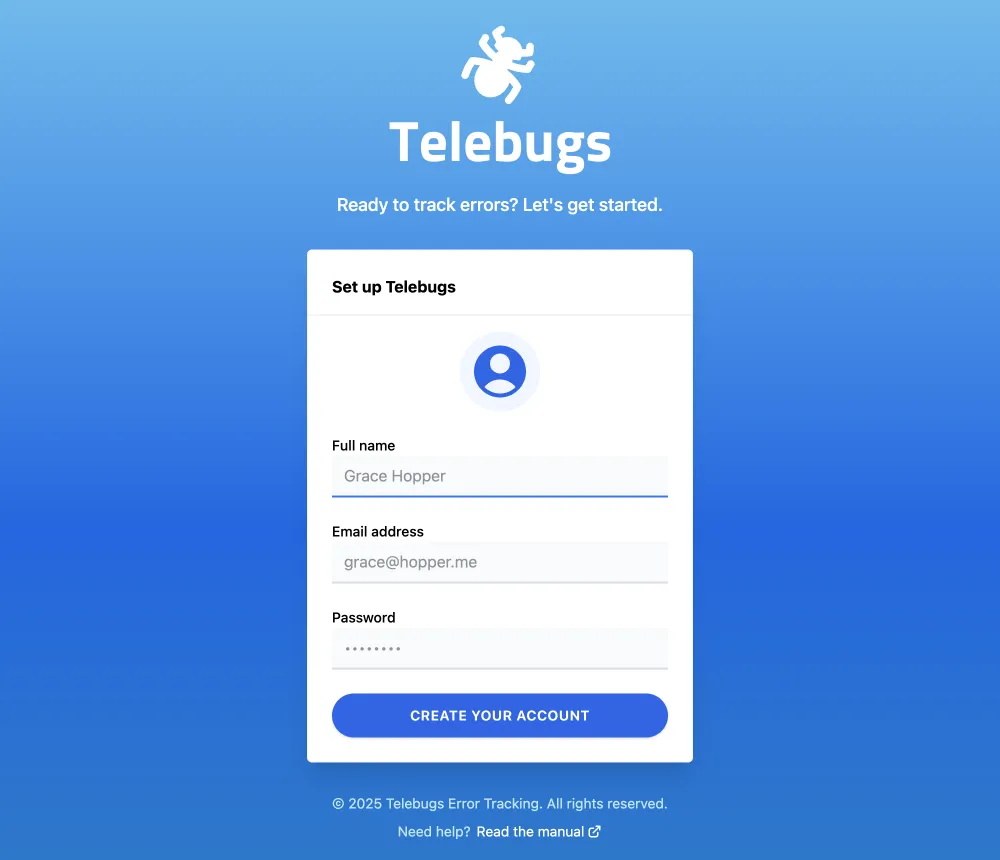
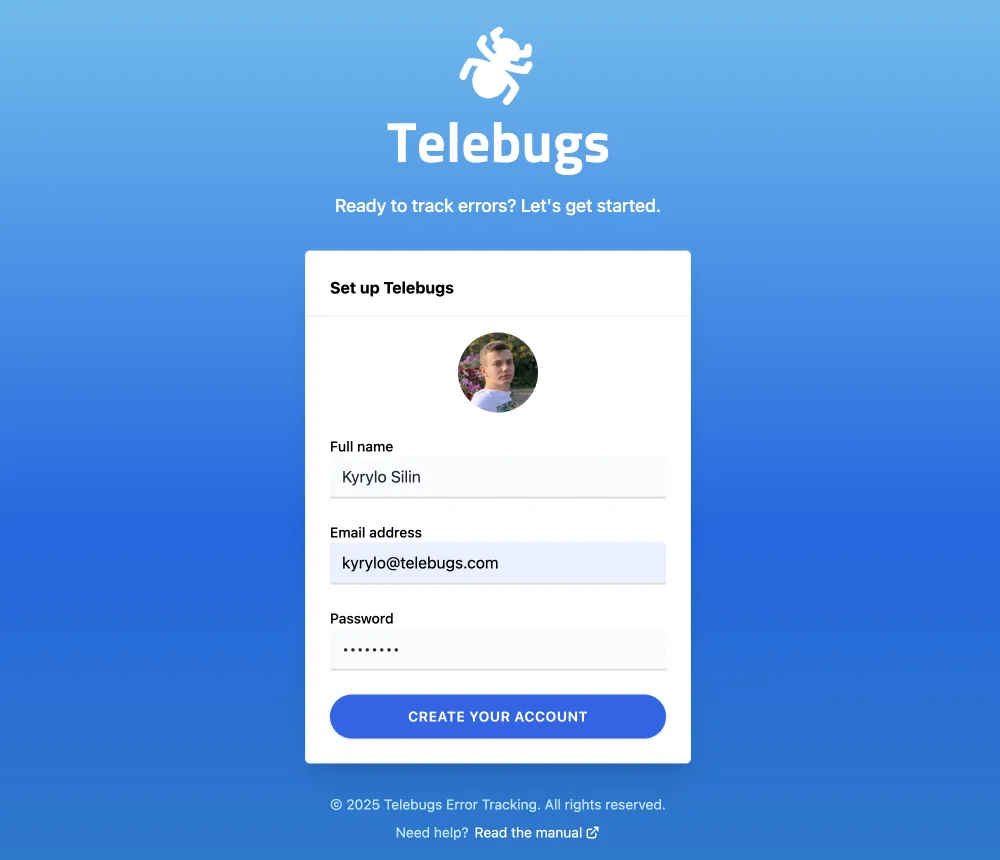
On first launch, you’ll arrive at the Set up Telebugs screen. From here, you can create your first user account and start using Telebugs.
Create your first user 
You’ll begin by creating an admin account. The setup form asks for:
- Profile picture: Optional. It will appear throughout the dashboard and be visible to your teammates.
- Full name: Any name works.
- Email address: Doesn’t have to match the one you used to purchase Telebugs. Use whatever email you like.
- Password: No strict rules here. Choose a password you trust. Telebugs assumes you know what you’re doing.
Hit Create your account, and you’re in! Your Telebugs journey has officially begun.
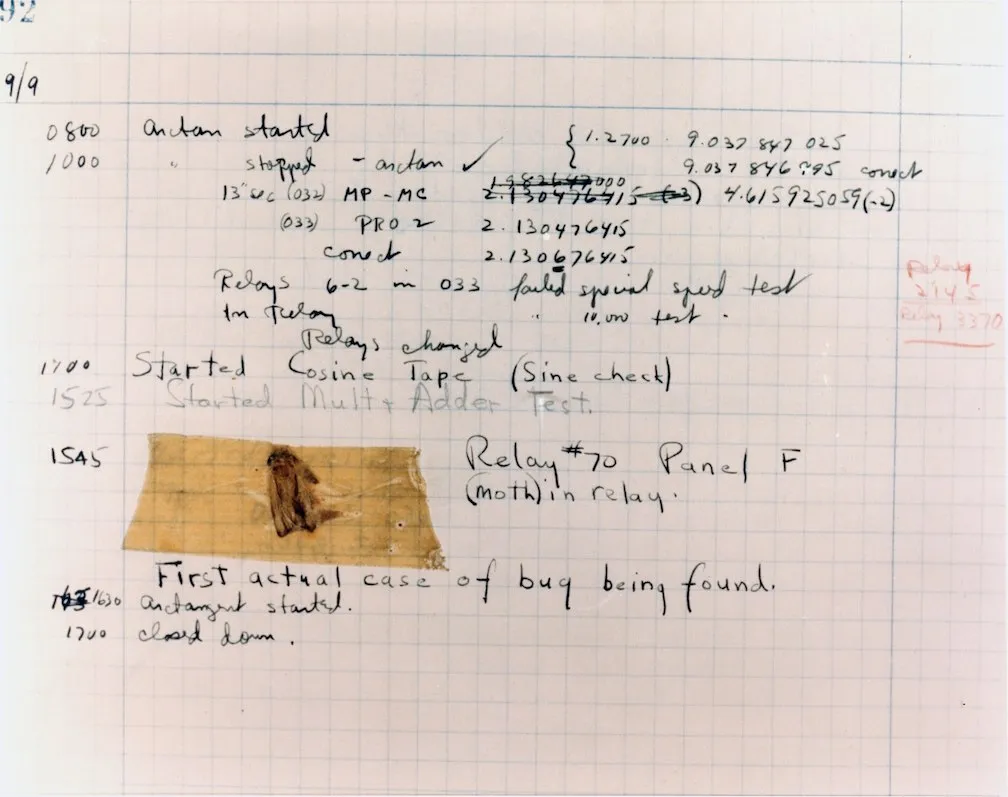
Fun fact 
Telebugs’ autocomplete suggests "Grace Hopper" for your name. Here’s why:
- Grace Hopper was a pioneering computer scientist and a U.S. Navy rear admiral.
- In 1945, her team discovered a real moth causing a malfunction — the first recorded "bug" in a computer system.
With Telebugs, you continue her tradition of squashing bugs (minus the moth wings).
6 Creating your project 
Ready to begin tracking errors effectively? In Telebugs, Projects are your organizational foundation — they keep errors from different apps, languages, or environments neatly separated. Each project gets its own unique token, which your code uses to send errors directly to Telebugs. This setup makes debugging efficient, whether you’re managing a monolithic app or a suite of microservices.
This chapter guides you through a recommended workflow for setting up projects, shares tips on organization, and explains the creation form. By the end, you’ll have a project tailored to your needs — let’s build something robust!
How to organize your projects 
Think of projects as folders for your errors: group them logically to avoid clutter. Here’s a flexible approach — mix and match based on your setup:
- By language or framework: The go-to method! Create one for Ruby errors, another for JavaScript bugs. This keeps context crystal clear (e.g., backend vs. frontend errors).
- By subsystem: Got web requests, background jobs, or cron tasks? Split them out if you want granular control over notifications or access.
- By environment: Track staging bugs separately from production ones. Pro tip: Use naming conventions like "App-Prod" and "App-Staging" for easy spotting.
- Custom organization: Feeling rebellious? Lump everything into one mega-project or slice it by team/department. Telebugs doesn’t judge — do what fits your workflow!
Using apps to organize projects 
For a convenient way to group related projects, leverage Apps in Telebugs. Apps are perfect for combining backend and frontend projects, the most common setup for web applications. For example, you can create an app that groups your Ruby backend and JavaScript frontend projects together for unified management. This approach simplifies navigation and keeps related projects organized. To learn how to create, edit, pin, or delete an app, see the Apps section for detailed instructions.
Example project organization 
Let’s make this real with a sample web app. Imagine you’re running a blog built on Ruby on Rails with some JavaScript flair:
Web app (Ruby on Rails) 
- Project name:
Blogorblog.example.com - Purpose: Snag those sneaky server-side Ruby errors from your Rails backend. Perfect for tracking controller crashes or database hiccups.
Frontend (JavaScript) 
- Project name:
Blog (JavaScript)orblog.js - Purpose: Catch browser blunders like DOM mishaps or API call fails. Keeps client-side issues isolated from server errors.
This split lets you assign different teams (e.g., backend devs vs. frontend wizards) and tailor notifications. Bonus: Spot patterns faster, like if JS errors spike after a Rails deploy!
The ‘New Project’ form 
Fire up a new project by clicking the New Project button in the top-right of your dashboard. You’ll land on this sleek form — fill it out, hit create, and you’re off to the races!
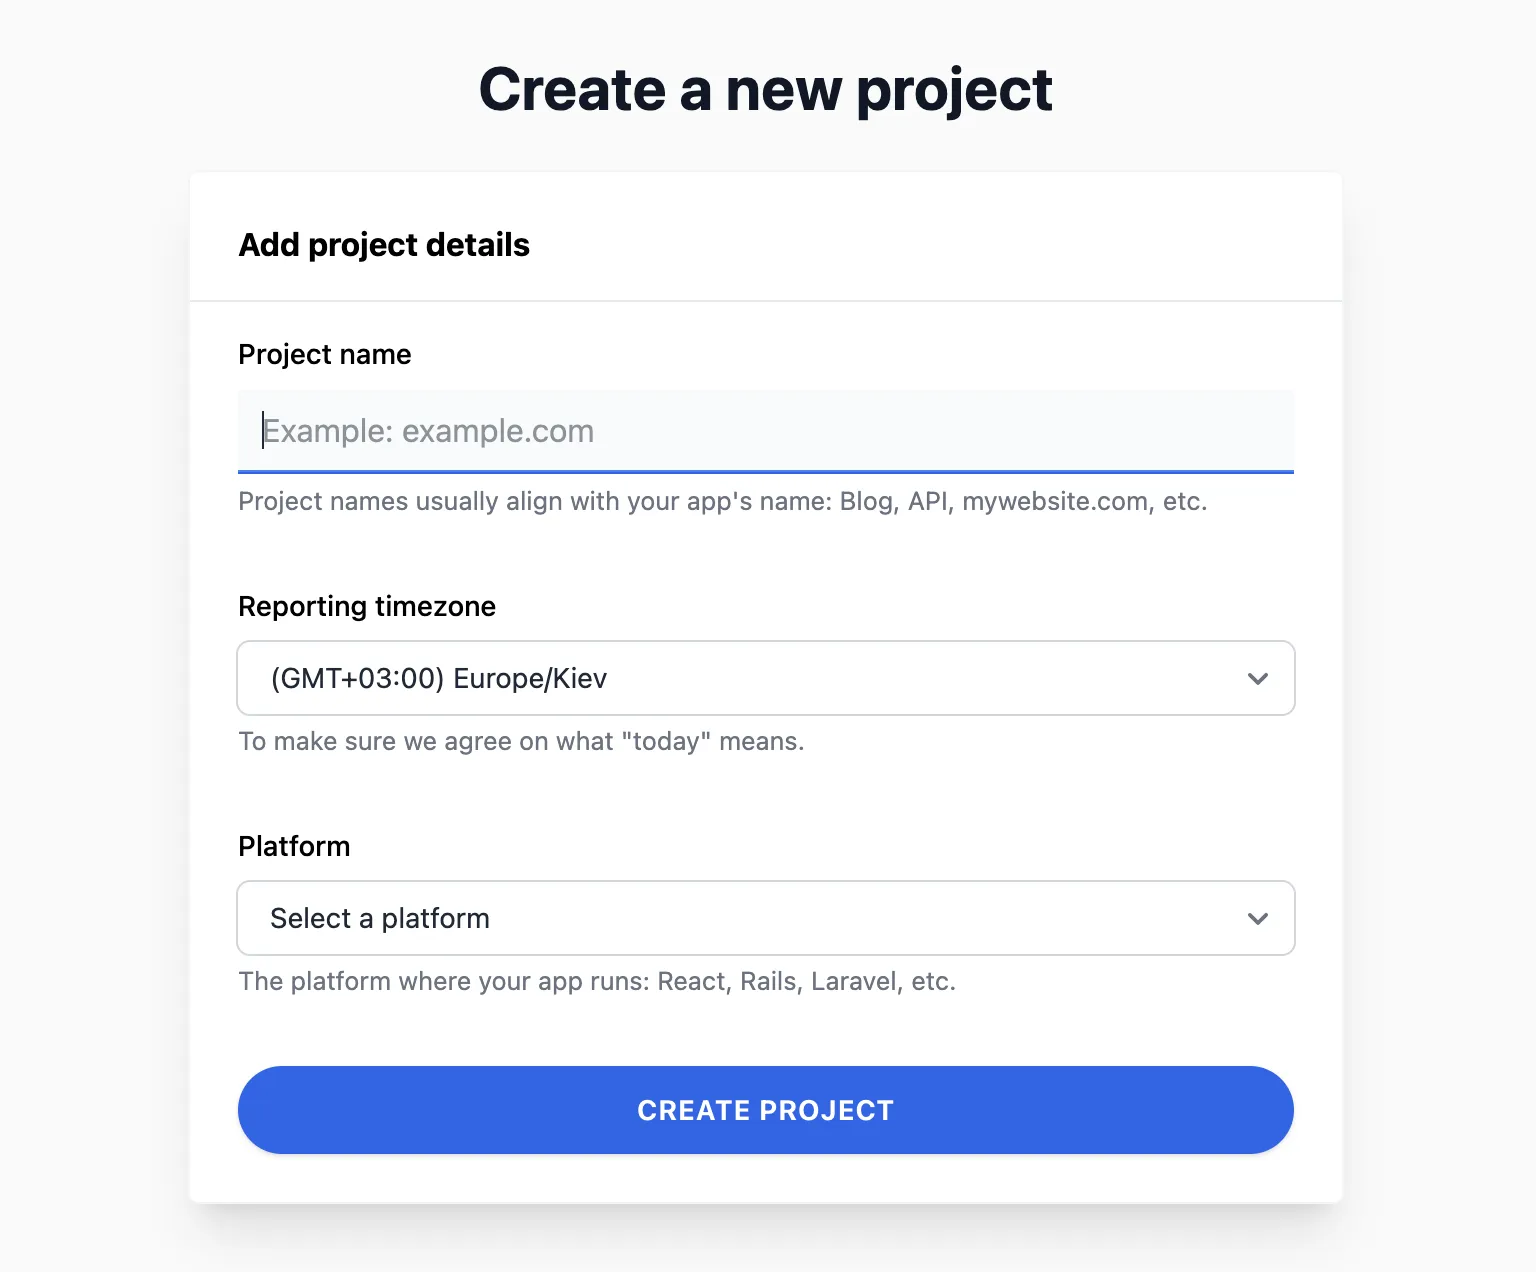
Breaking down the fields so you know exactly what to pick:
| Name | Description |
|---|---|
| Project name | Your project’s alias — go wild with characters! Make it snappy and descriptive, like "Ecommerce Backend" for quick recognition. |
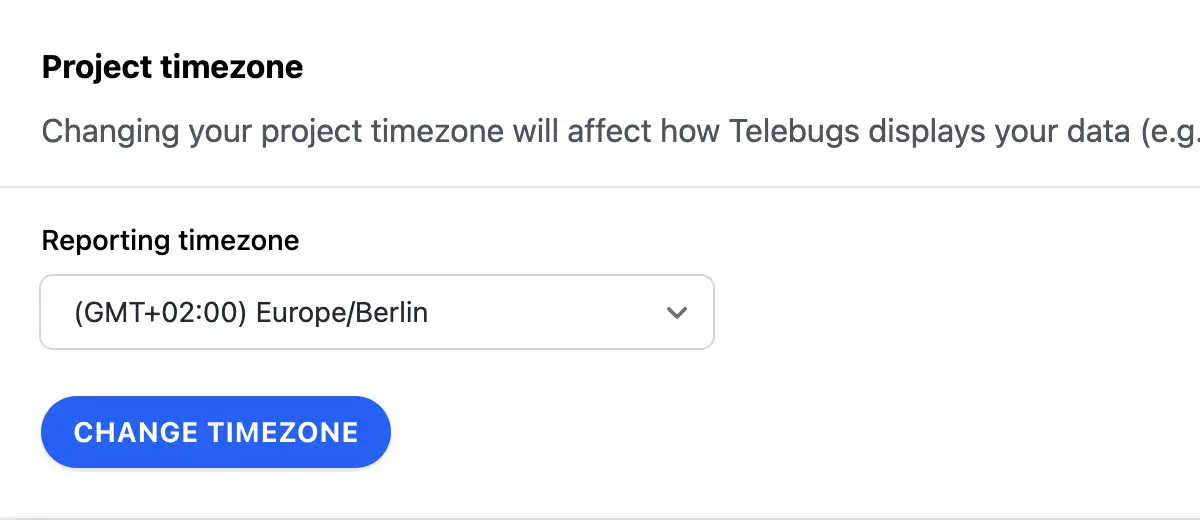
| Reporting timezone | Starts with your local time, but tweak it to match your servers or team (UTC for global ops?). This powers "today’s errors" views and graphs — super handy for time-sensitive debugging. |
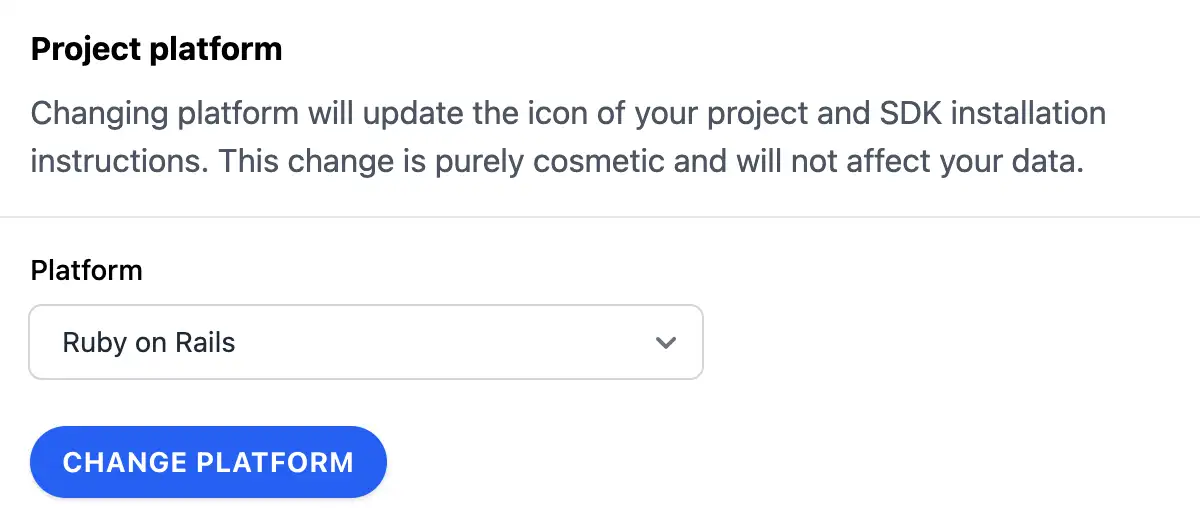
| Platform | Choose your tech stack (e.g., Ruby, JavaScript). Right now, it jazzes up your project icon and tunes SDK guides; future updates might add platform-specific smarts. |
Once created, grab that shiny new token and plug it into your app’s config. Test by triggering a harmless error — watch it appear in your dashboard! With projects set, you’re primed for the next step: integrating Telebugs into your code. Flip to the integration chapter and let’s get reporting!
7 Sending your first error report 
You’ve got your project set up — excellent! Now comes the key step: sending that first error report to Telebugs. This connects your app to Telebugs so it can start catching and displaying those pesky bugs automatically. This chapter guides you through integrating a Sentry SDK, troubleshooting common issues, and what to expect next. By the end, you’ll be seeing real error data roll in. Let’s connect your app to Telebugs!
Introduction to error reports 
Error reports are the lifeblood of debugging — they’re like detailed snapshots of what went wrong in your app. You might call them exceptions, crashes, or stack traces, but in Telebugs, we stick with "error reports" because that’s how you’ll interact with them in Telebugs’ clean, intuitive UI. These reports include everything from the error message to the code path that led there, helping you fix issues fast. Think of it as your app’s way of saying, "Hey, something broke — here’s the full story!"
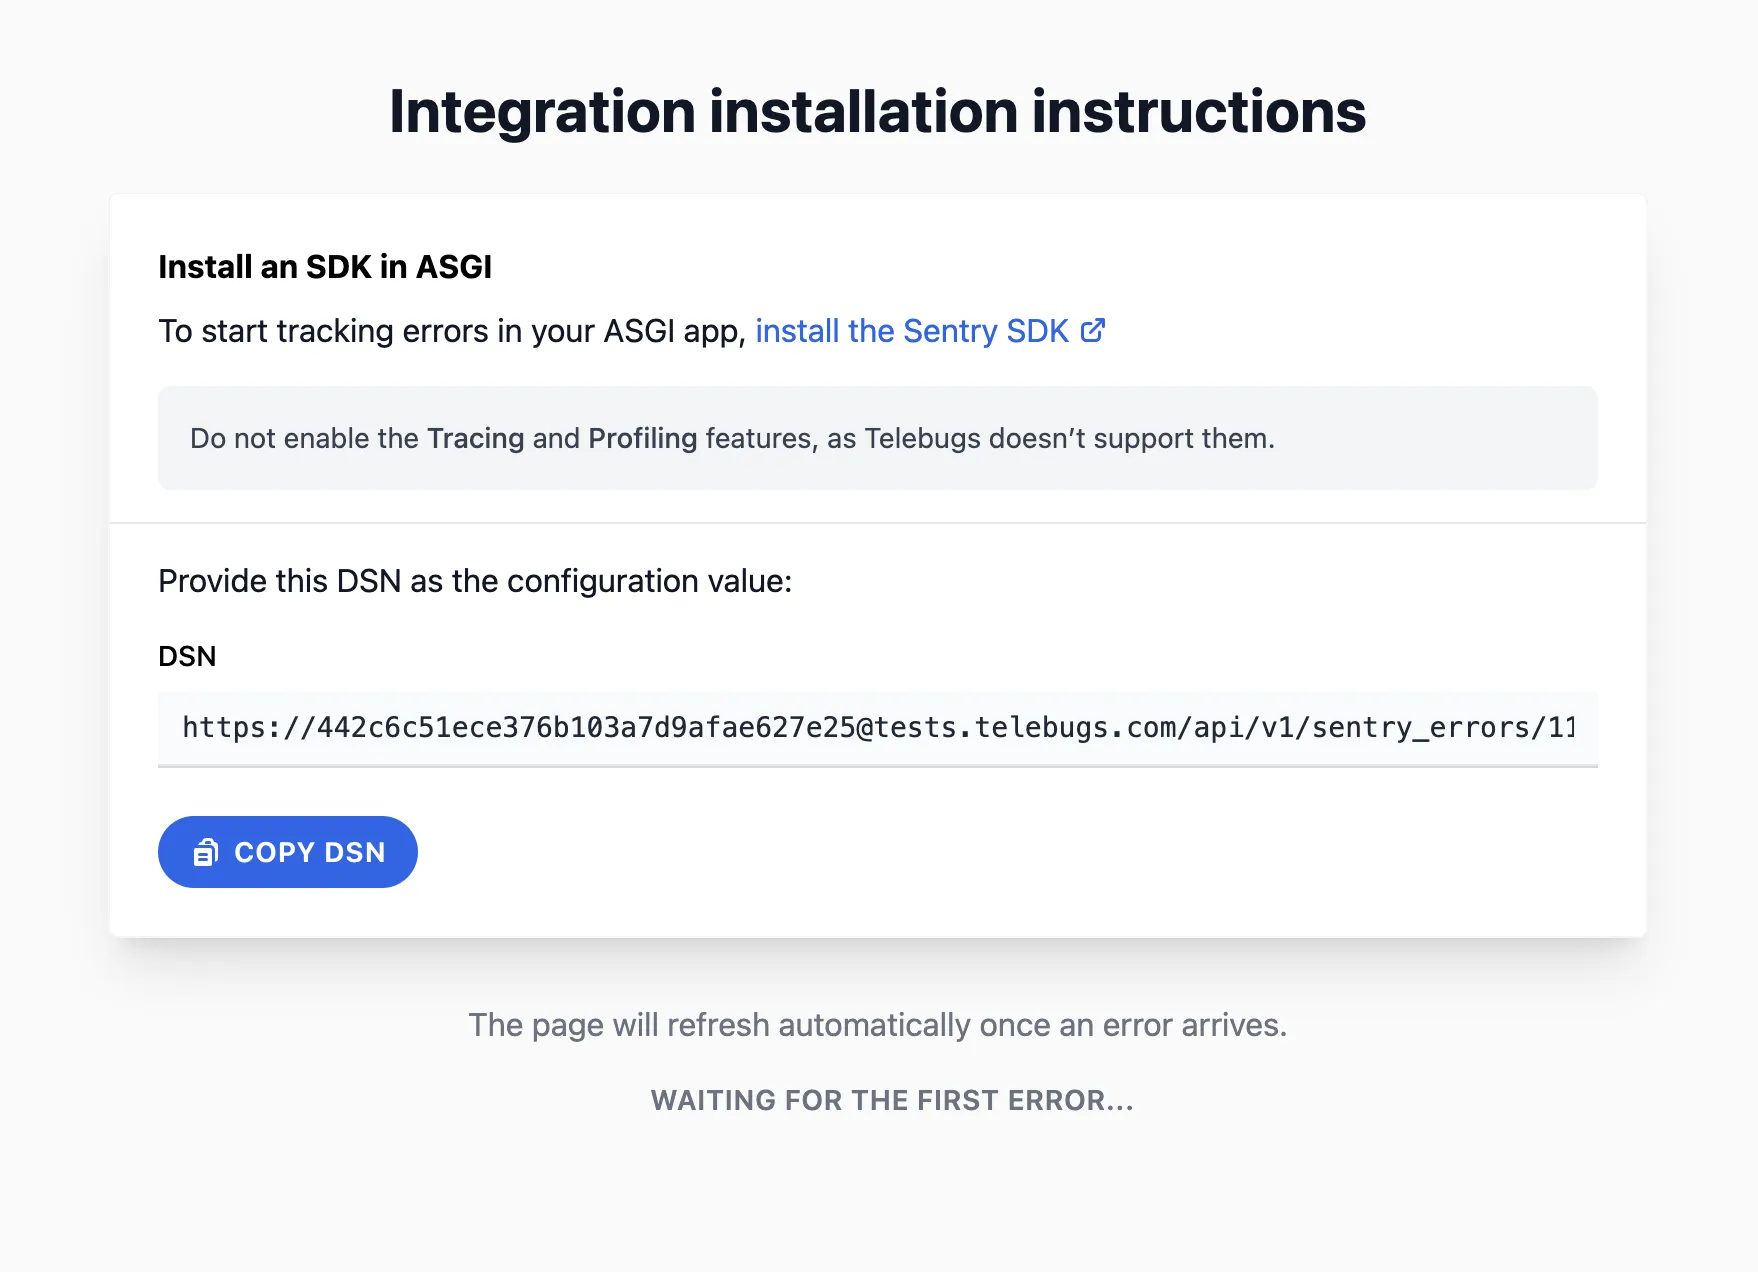
Viewing installation instructions 
If your project is fresh and error-free, Telebugs greets you with tailored SDK setup instructions right on the dashboard. No guesswork needed! These steps link straight to Sentry’s official docs, customized for the platform you picked during project creation. Spot the DSN (Data Source Name) here — it’s your project’s unique address for sending errors.
Installing the Sentry SDK 
Time to get hands-on! Follow Sentry’s platform-specific guide to add the SDK to your app. It’s usually a quick gem install, package add, or script include.
Here’s a snappy example for Ruby on Rails to give you the feel:
- Add the gem to your Gemfile:
# Gemfile
gem "sentry-rails"
- Install it:
$ bundle install
- Initialize in a config file:
# config/initializers/sentry.rb
Sentry.init do |config|
  config.dsn = "https://[email protected]/123"
  config.breadcrumbs_logger = [ :active_support_logger, :http_logger ]
  config.send_default_pii = true  # Optional: Adds user context like IP
end
Restart your server after setup. For other platforms like JavaScript or Python, the process is similar — just swap in the right package and config. If you’re new to Sentry, their docs are gold — follow along closely.
Using your Telebugs DSN 
The DSN is your secret sauce: a URL that routes errors from your app to
Telebugs. Grab it from your project page (it looks like
https://[email protected]/project-id). Paste it exactly into your
SDK init code — no typos! Quick check: Trigger a test error in your app (e.g.,
raise "Test error" in Ruby). If it shows up in Telebugs, you’re golden.
No luck? Verify the DSN and restart.
Feature compatibility notes 
Telebugs focuses on rock-solid error tracking, so stick to core features. Turn
off Tracing, Profiling, Session Replay, or Performance Monitoring in your SDK
config — they won’t work here and might clutter things. But go wild with
breadcrumbs, contexts, and tags — they enrich your reports beautifully! Example
tweak in config: Set config.traces_sample_rate = 0.0 to disable tracing.
Common mistakes and troubleshooting 
Hitting a snag? You’re not alone — here’s how to squash the usual suspects:
- SDK installed, but no reports show: Is your app actually erroring? Force one with a deliberate crash. Also, check if the SDK is initialized early in your app lifecycle.
- "Invalid DSN" woes: Copy-paste the full DSN again — easy to miss a character. Test with a minimal setup if needed.
- Changes not sticking: Always restart your app or server post-config. In containers? Redeploy.
- Firewall or network blocks: Ensure your app can reach Telebugs’ API endpoint.
Still stuck? Double-check Sentry docs for your platform or drop me a line — I’m here to help!
Next steps 
Boom — your first error just landed! Telebugs auto-updates the dashboard, so watch those reports flow in. Now explore:
- Dive into error details: Stack traces, contexts, and more (see Error reports).
- Resolve or assign issues: Keep your backlog tidy.
- Set up notifications: Get alerted in real-time (see Notifications).
- Invite your team: Share the debugging love (see Team management).
Pro tip: Simulate a few errors with different scenarios to see how Telebugs handles them. It’ll build your confidence fast!
Glossary 
Quick reference for the jargon:
- Error report
Your app’s "oops" moment captured: message, stack trace, and context.
- DSN
Data Source Name: The URL directing errors to your Telebugs project.
- SDK
Software Development Kit: The library you add to auto-report errors.
- Breadcrumb
Trail of events before the crash — super helpful for "what happened?"
- Platform
Your app’s tech (e.g., Ruby on Rails) — guides SDK choice and setup.
8 Team management 
You’ve nailed your first project and started catching those errors — now it’s time to level up by bringing in the squad!
Team management in Telebugs lets you invite collaborators, dish out roles like a boss, lock down project access, and fine-tune notifications so everyone stays in the loop without the spam. Whether you’re scaling a solo gig to a full team or just sharing the load, this is your guide to building a bug-busting dream team. Let’s make collaboration seamless and secure!
To get started, click your profile icon in the top-right, select Team
Management, and explore the tabs. We’ll break it down with tips to keep things
smooth. 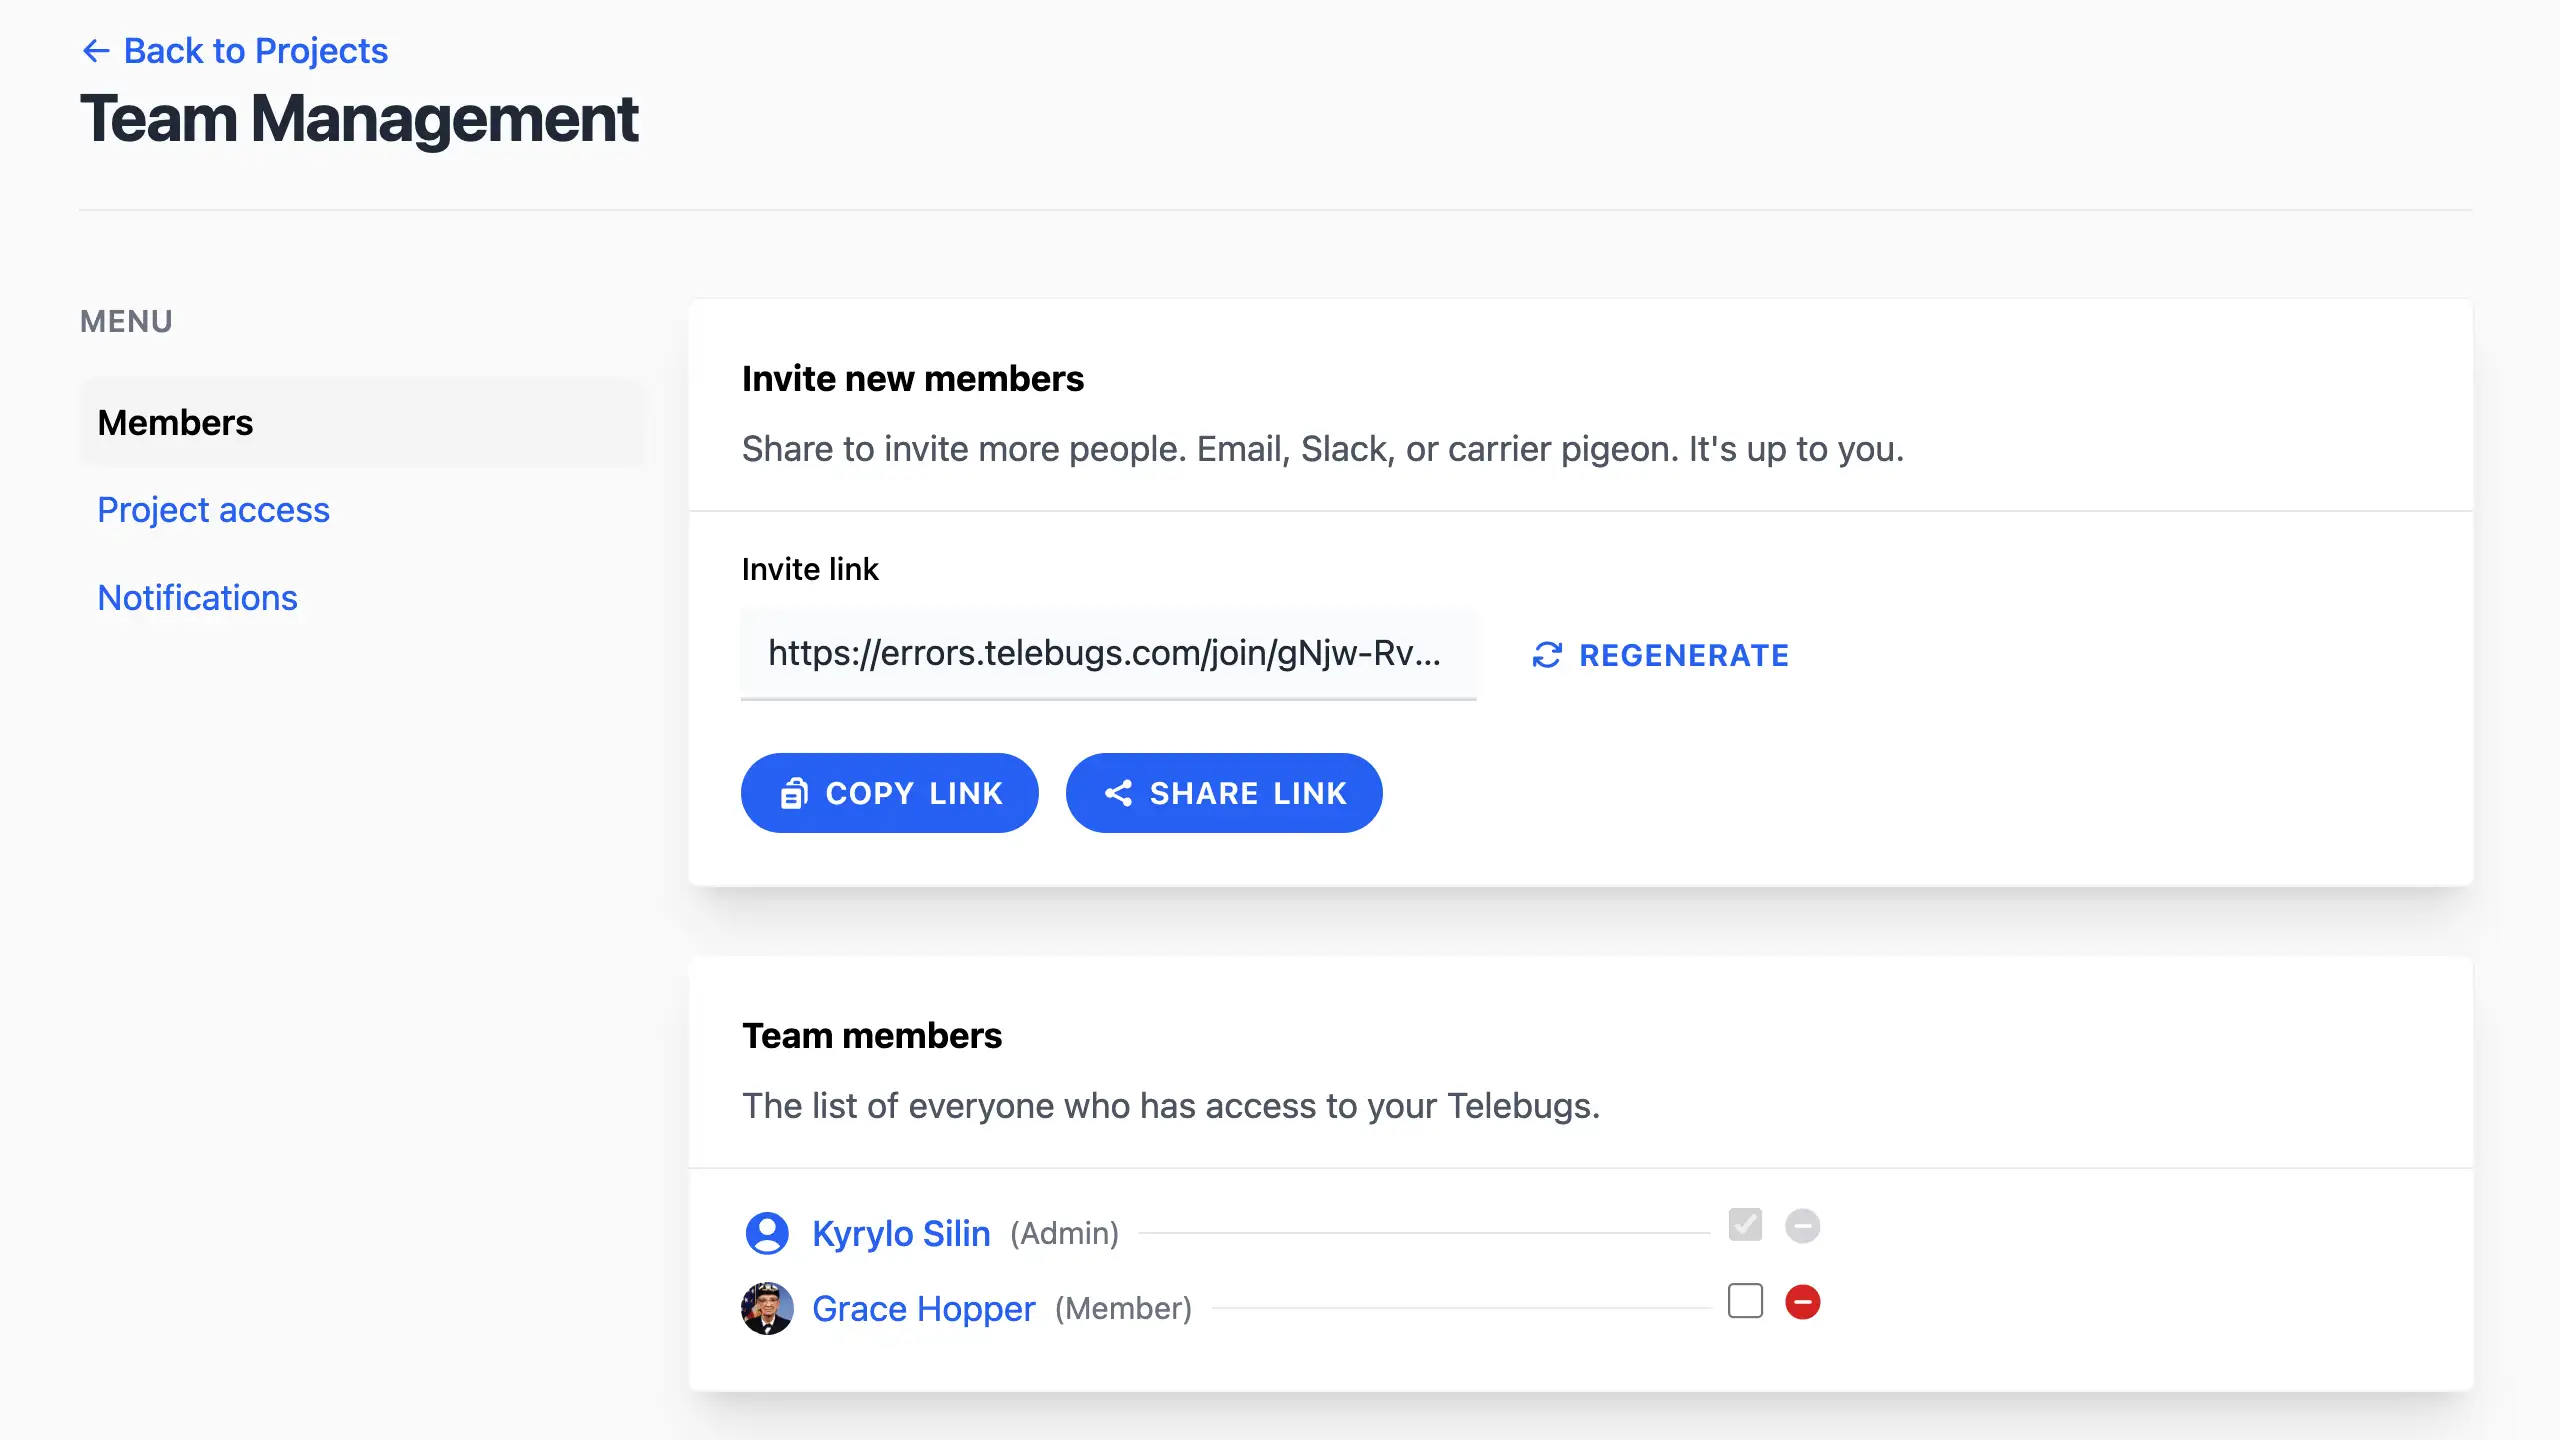
- Team roles
- Inviting team members
- Joining Telebugs as a team member
- Promoting or demoting team members
- Removing team members
- Recovering a team member’s access
- Project access
- Team notifications
8.1 Team roles 
Telebugs keeps permissions simple yet powerful with a role-based system. This ensures the right people see the right stuff, protecting sensitive data while boosting productivity. There are two straightforward roles:
- Admin: The all-access pass holders. They can tweak settings, manage projects, invite/remove users, and dive into every error report. Perfect for leads or trusted overseers.
- Member: The focused contributors. They view and resolve errors in assigned projects but can’t change configs or handle team stuff. Ideal for devs or testers who just need to fix bugs.
Pro tip: Start small — make new joins members, then promote as trust builds. This keeps your instance tidy and secure.
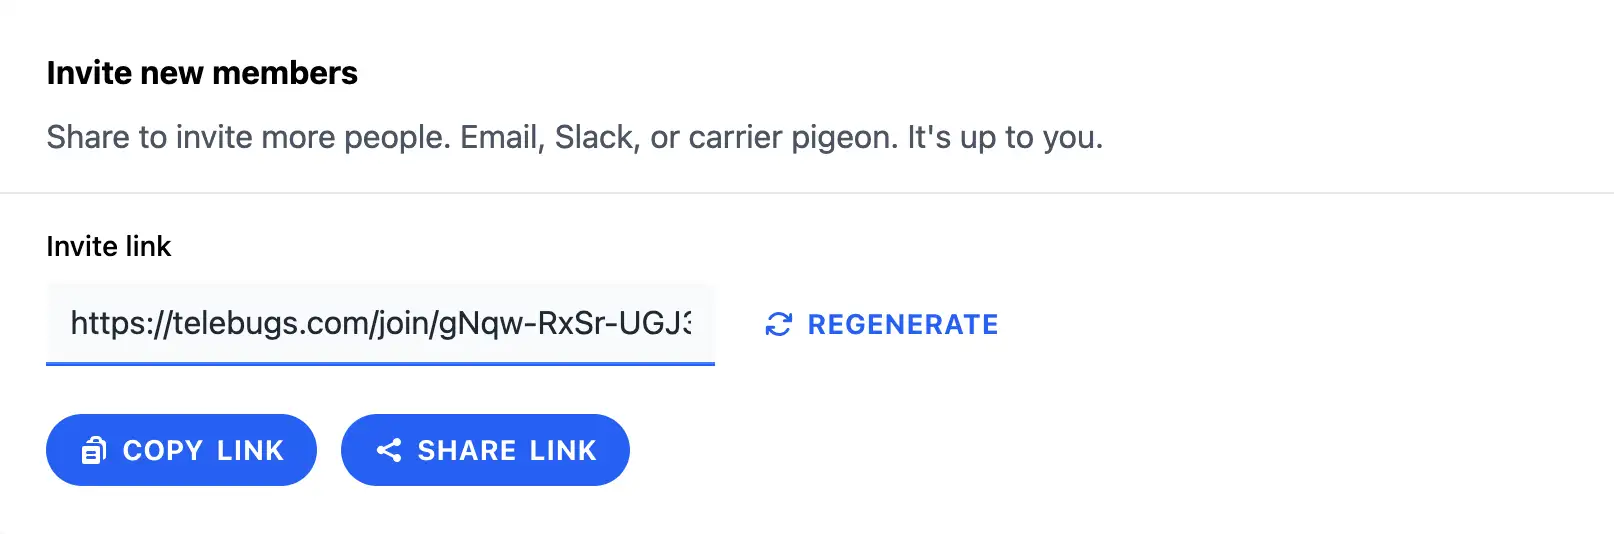
8.2 Inviting team members 
Ready to expand your crew? Inviting is easy and gets everyone on board fast.
- Head to Team Management > Members.
- Spot the invite section and click Copy link or Share link to grab the magic URL.
- Send it via email, Slack, or carrier pigeon — whatever works for your team.
The link’s universal (not user-specific), so share wisely with trusted folks only. If it leaks? No sweat — hit Regenerate to zap the old one and create a fresh link instantly.
Quick tip: Personalize your invite message with a quick note like "Join our Telebugs team to crush those bugs together!" It sets a collaborative tone.
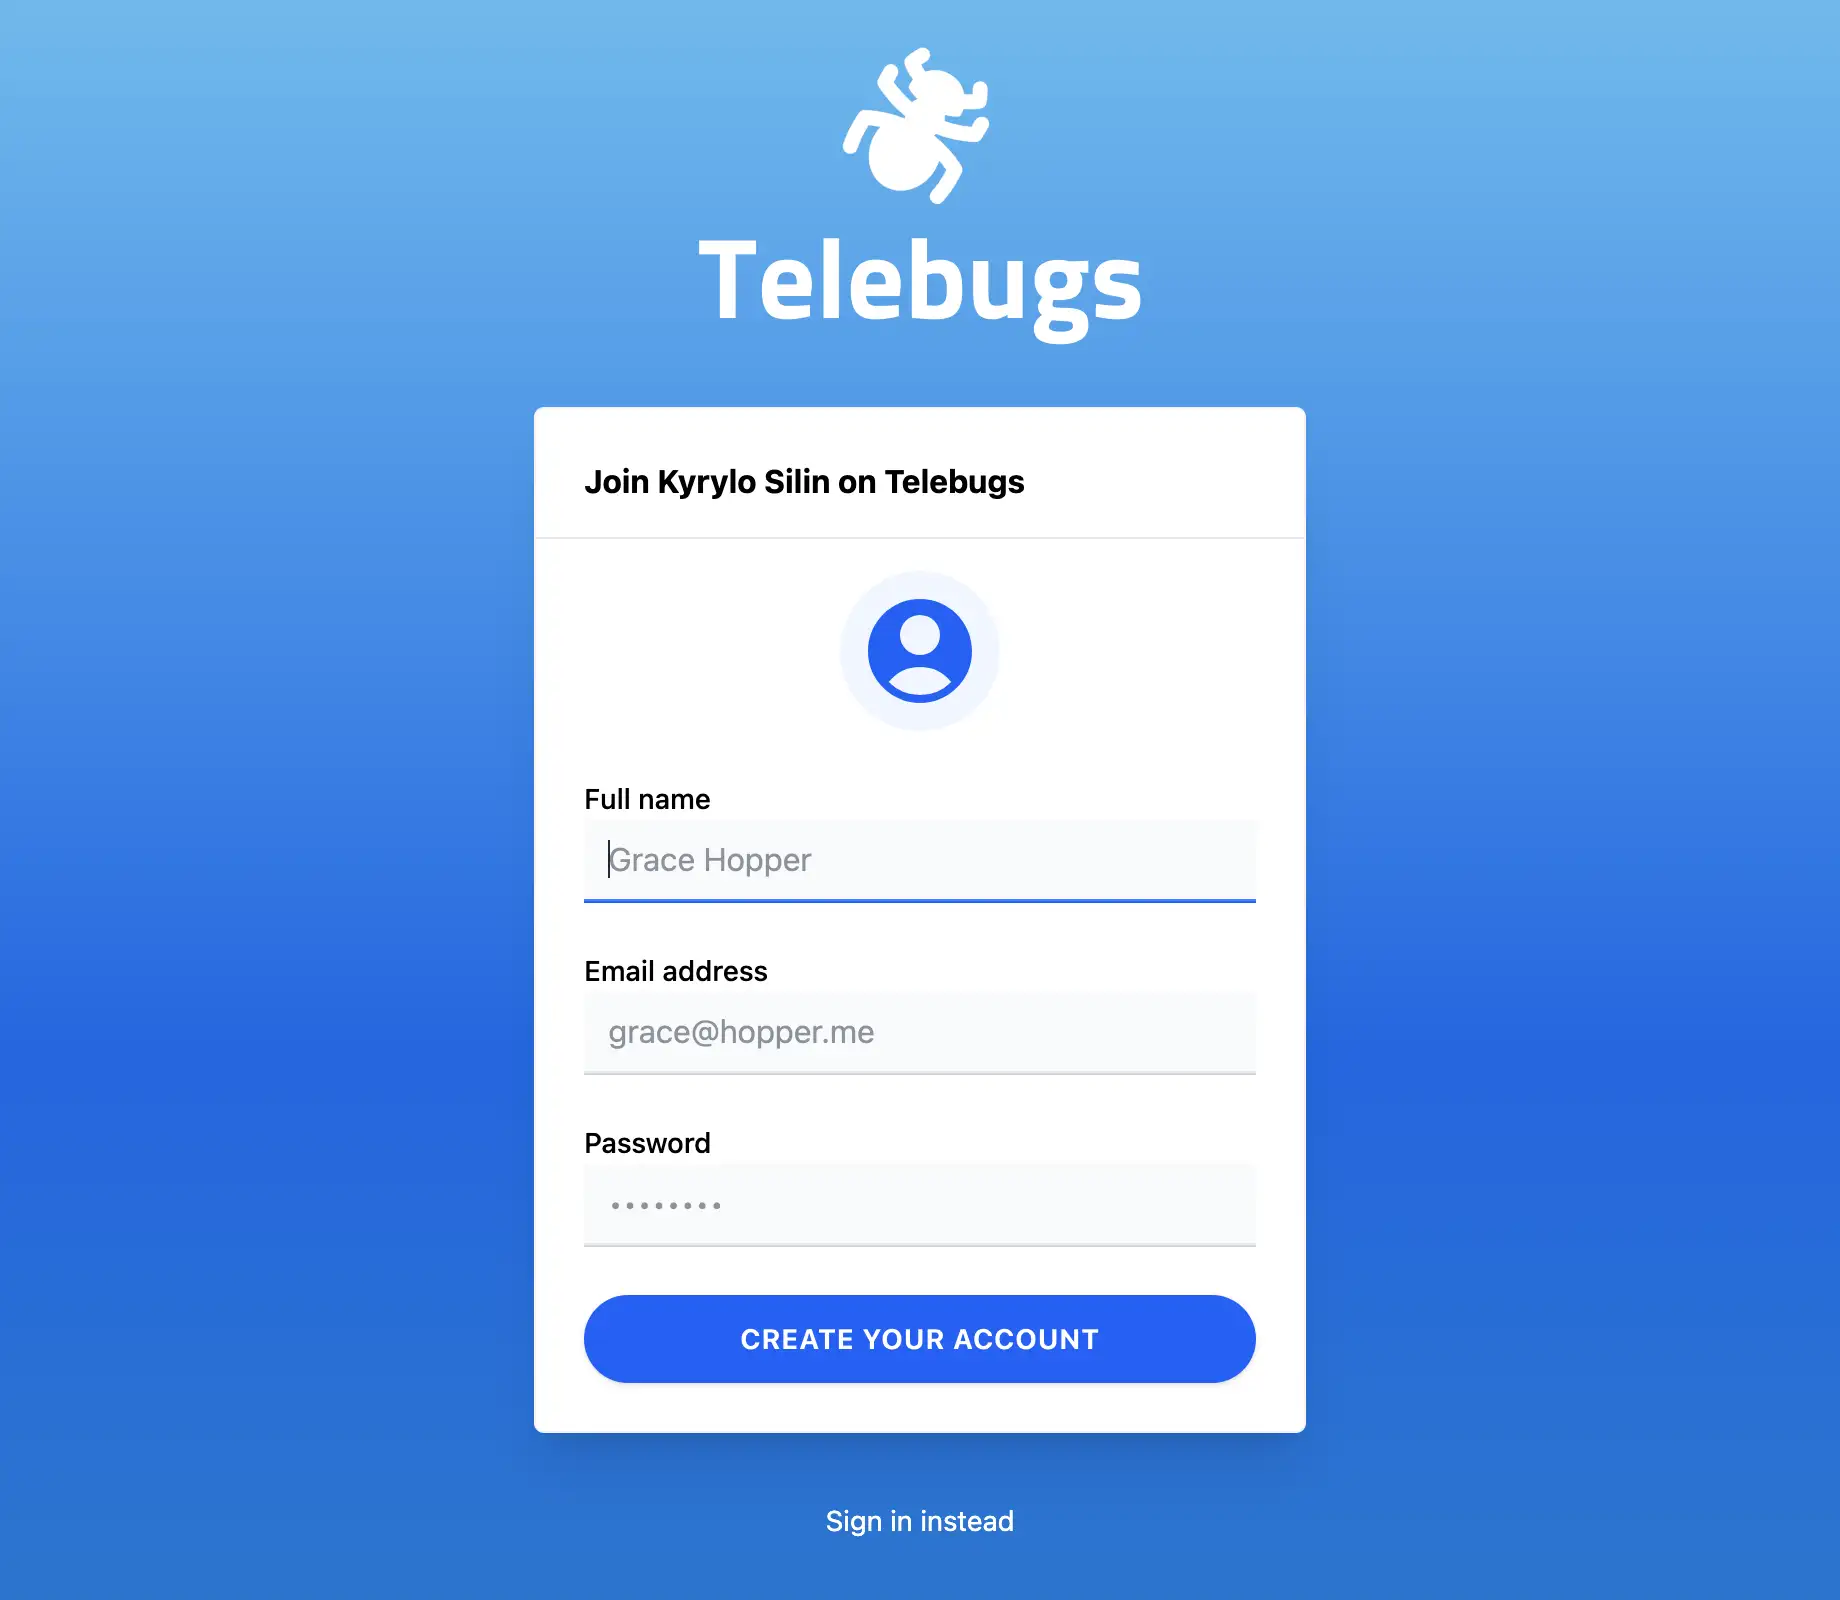
8.3 Joining Telebugs as a team member 
Got an invite link? You’re moments away from jumping in! Click it, and you’ll see a friendly prompt:
- If new, create an account with your details (name, email, password).
- If existing, just log in.
Post-join, you’ll land in a holding pattern — no projects yet! Ping your admin to get assigned (they’ll toggle you in via access controls). Once in, you’ll see errors and can start resolving.
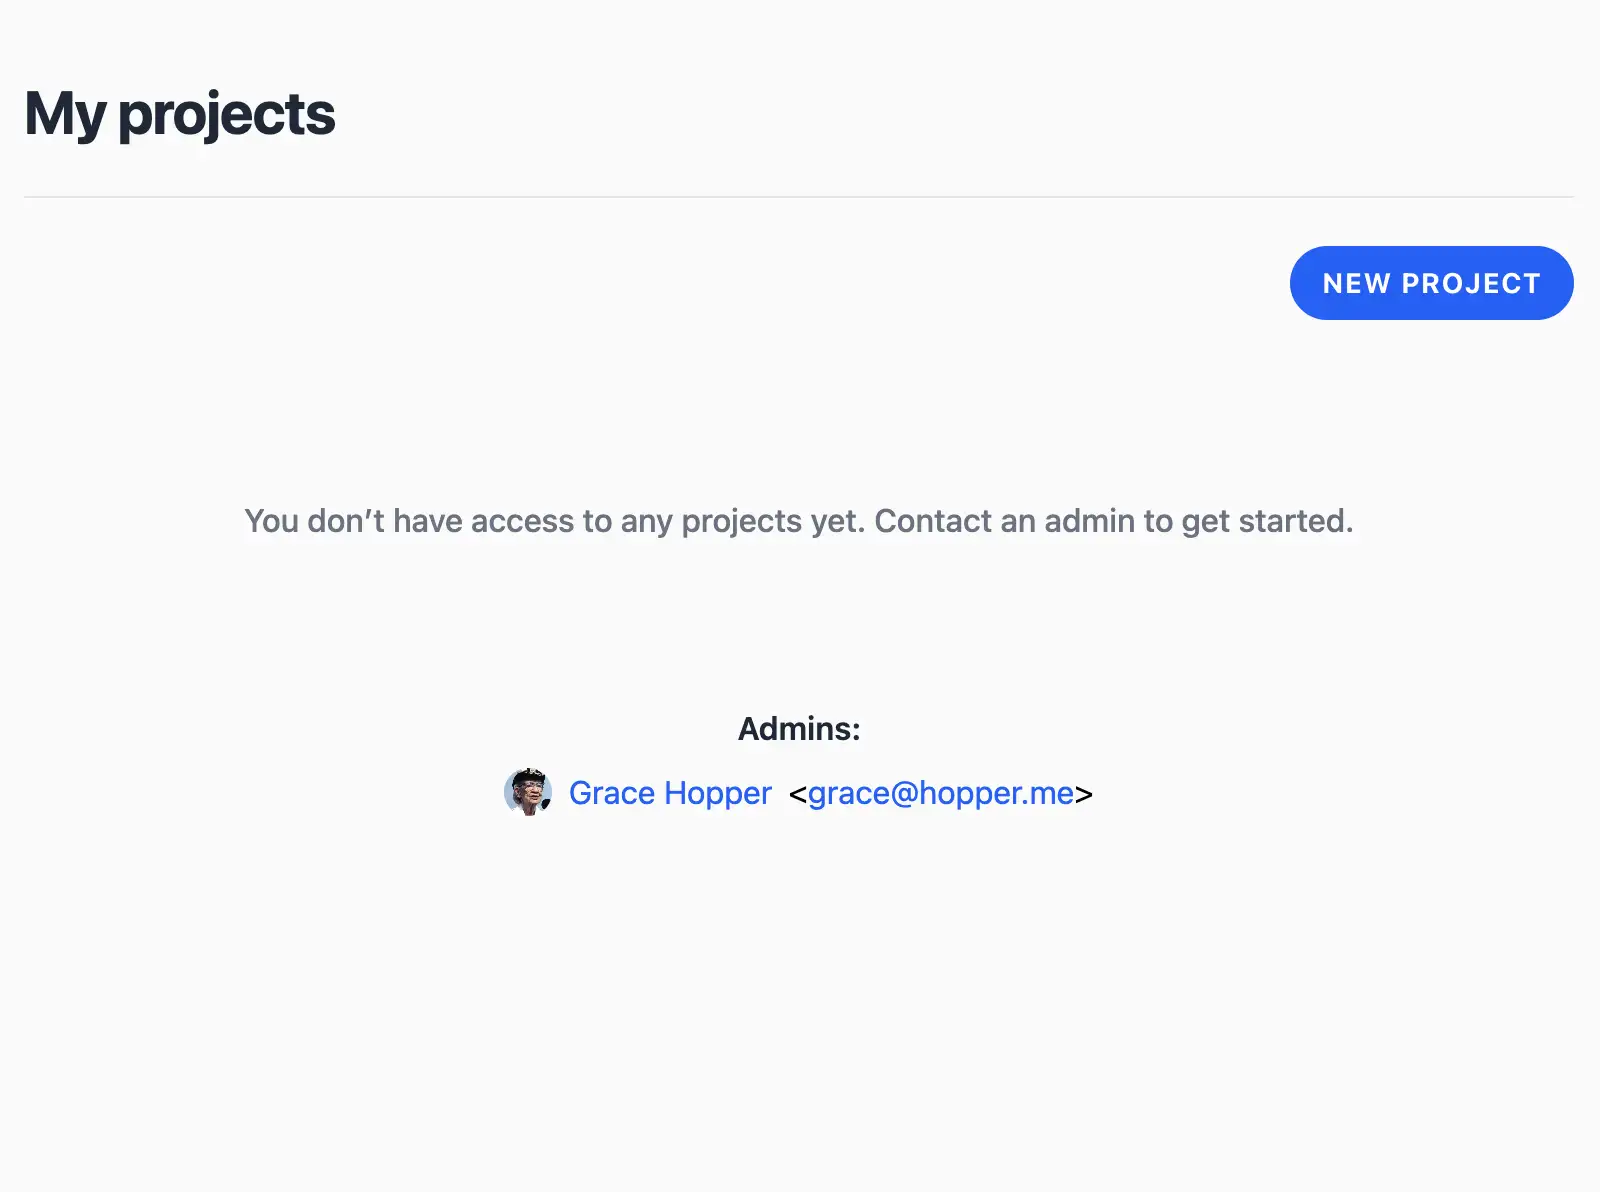
Heads-up: If you’re granted admin powers later, you’ll unlock full settings access. Until then, enjoy the focused view!
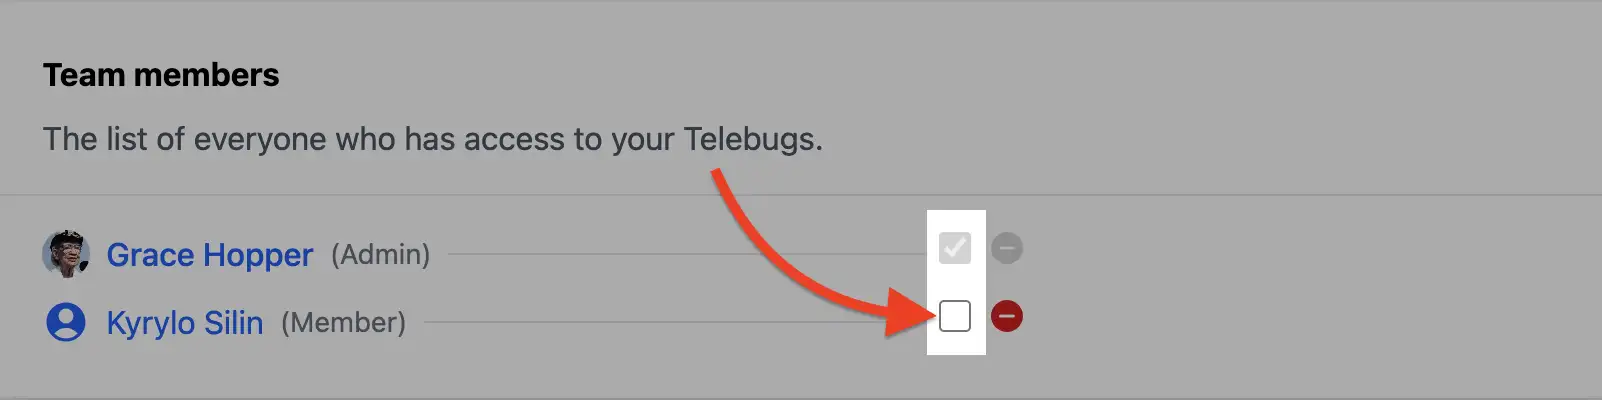
8.4 Promoting or demoting team members 
As your team evolves, so do roles. Need to elevate a star performer or dial back access? It’s a simple toggle.
- Go to Team Management > Members.
- Find the user and check (promote to admin) or uncheck (demote to member) the box next to their name.
- Changes save automatically — no extra clicks needed.
Pro tip: Communicate changes upfront to avoid surprises. For example, "Hey team, promoting Alex to admin for better project oversight!"
8.5 Removing team members 
Sometimes teams shift — offboarding is quick and clean.
- Navigate to Team Management > Members.
- Click the stop sign icon next to the user’s name.
- Confirm, and they’re out — no more access to Telebugs.
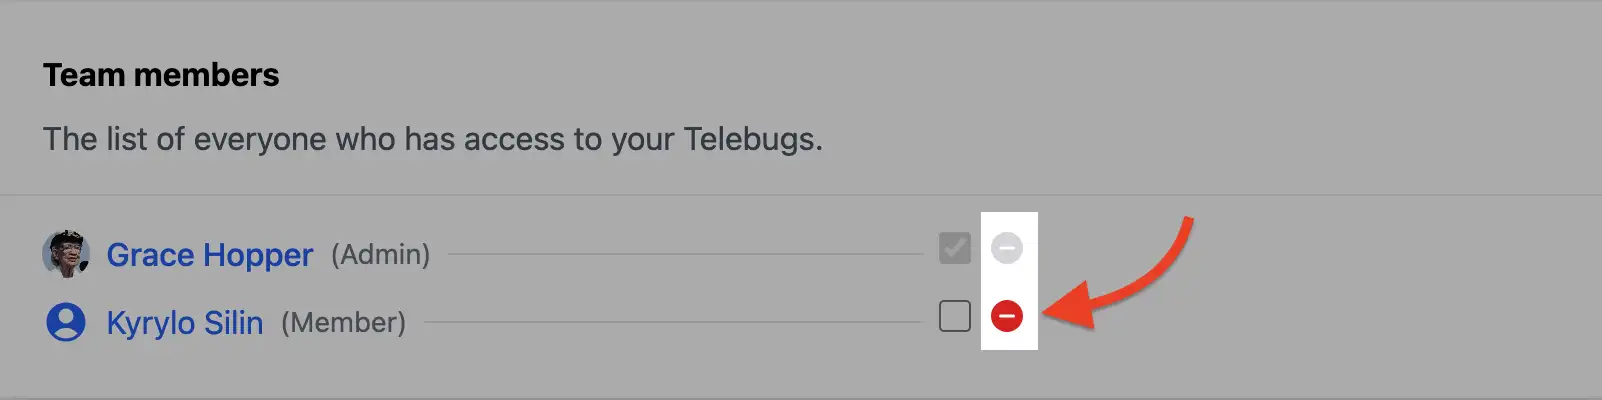
Gentle reminder: This revokes all access, so archive any needed notes first. It’s reversible by re-inviting, but better to handle gracefully.
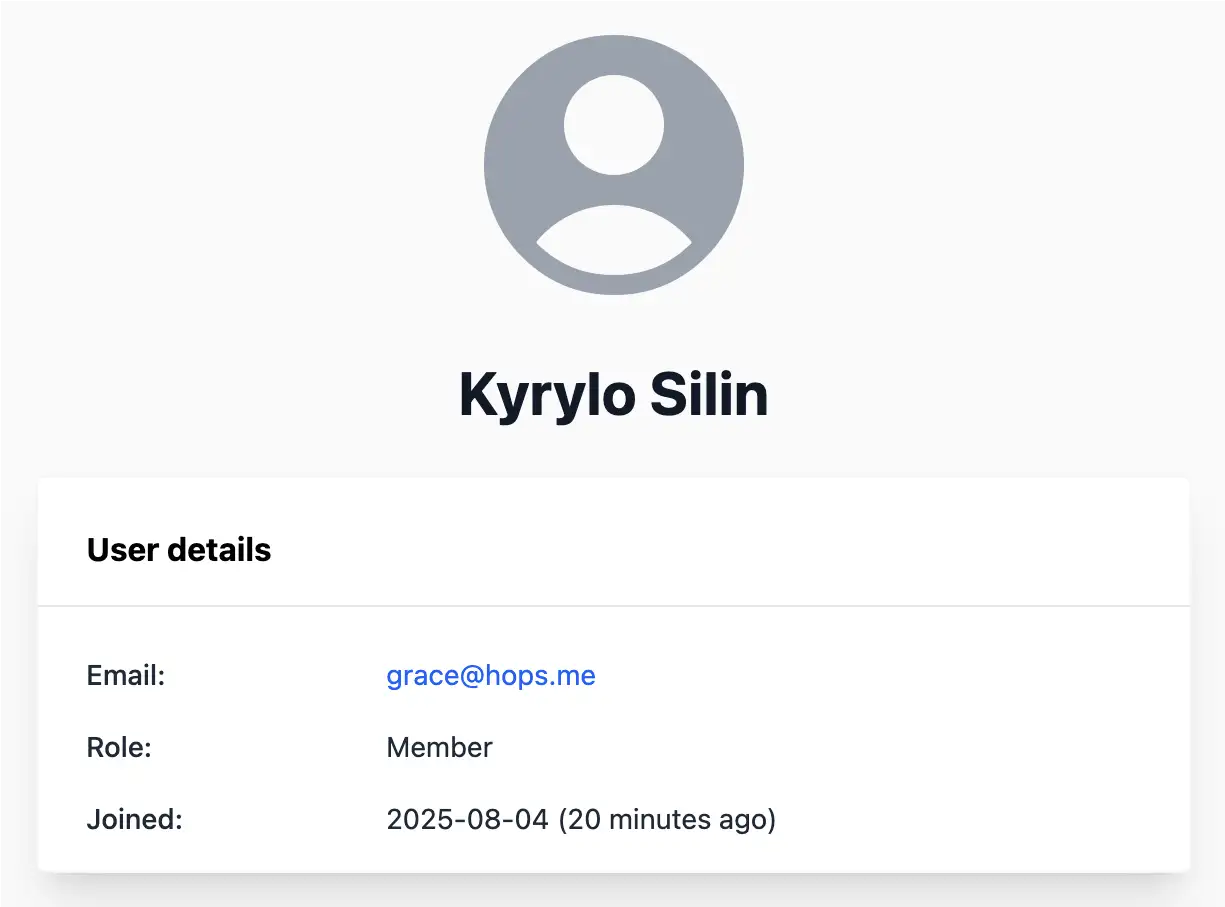
8.6 Recovering a team member’s access 
Forgotten password got someone locked out? As an admin, you’re the hero.
- In Team Management > Members, click the user’s name to open their profile.
- Scroll to Account recovery and copy/share the magic link.
- Send it their way
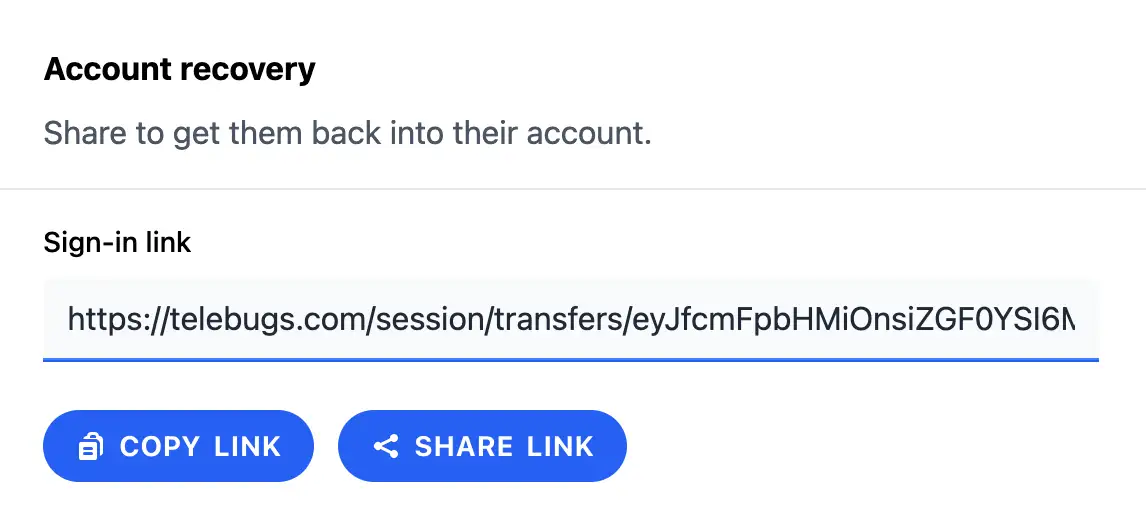
Quick win: This bypasses email resets, making recovery lightning-fast. Use it for quick fixes during crunch time!
8.7 Project access 
Not all projects are for everyone — assign access to keep things organized.
- Visit Team Management > Project access.
- For each user, check boxes next to projects they should join (unchecked means no-go).
- Saves instantly—users get access right away.
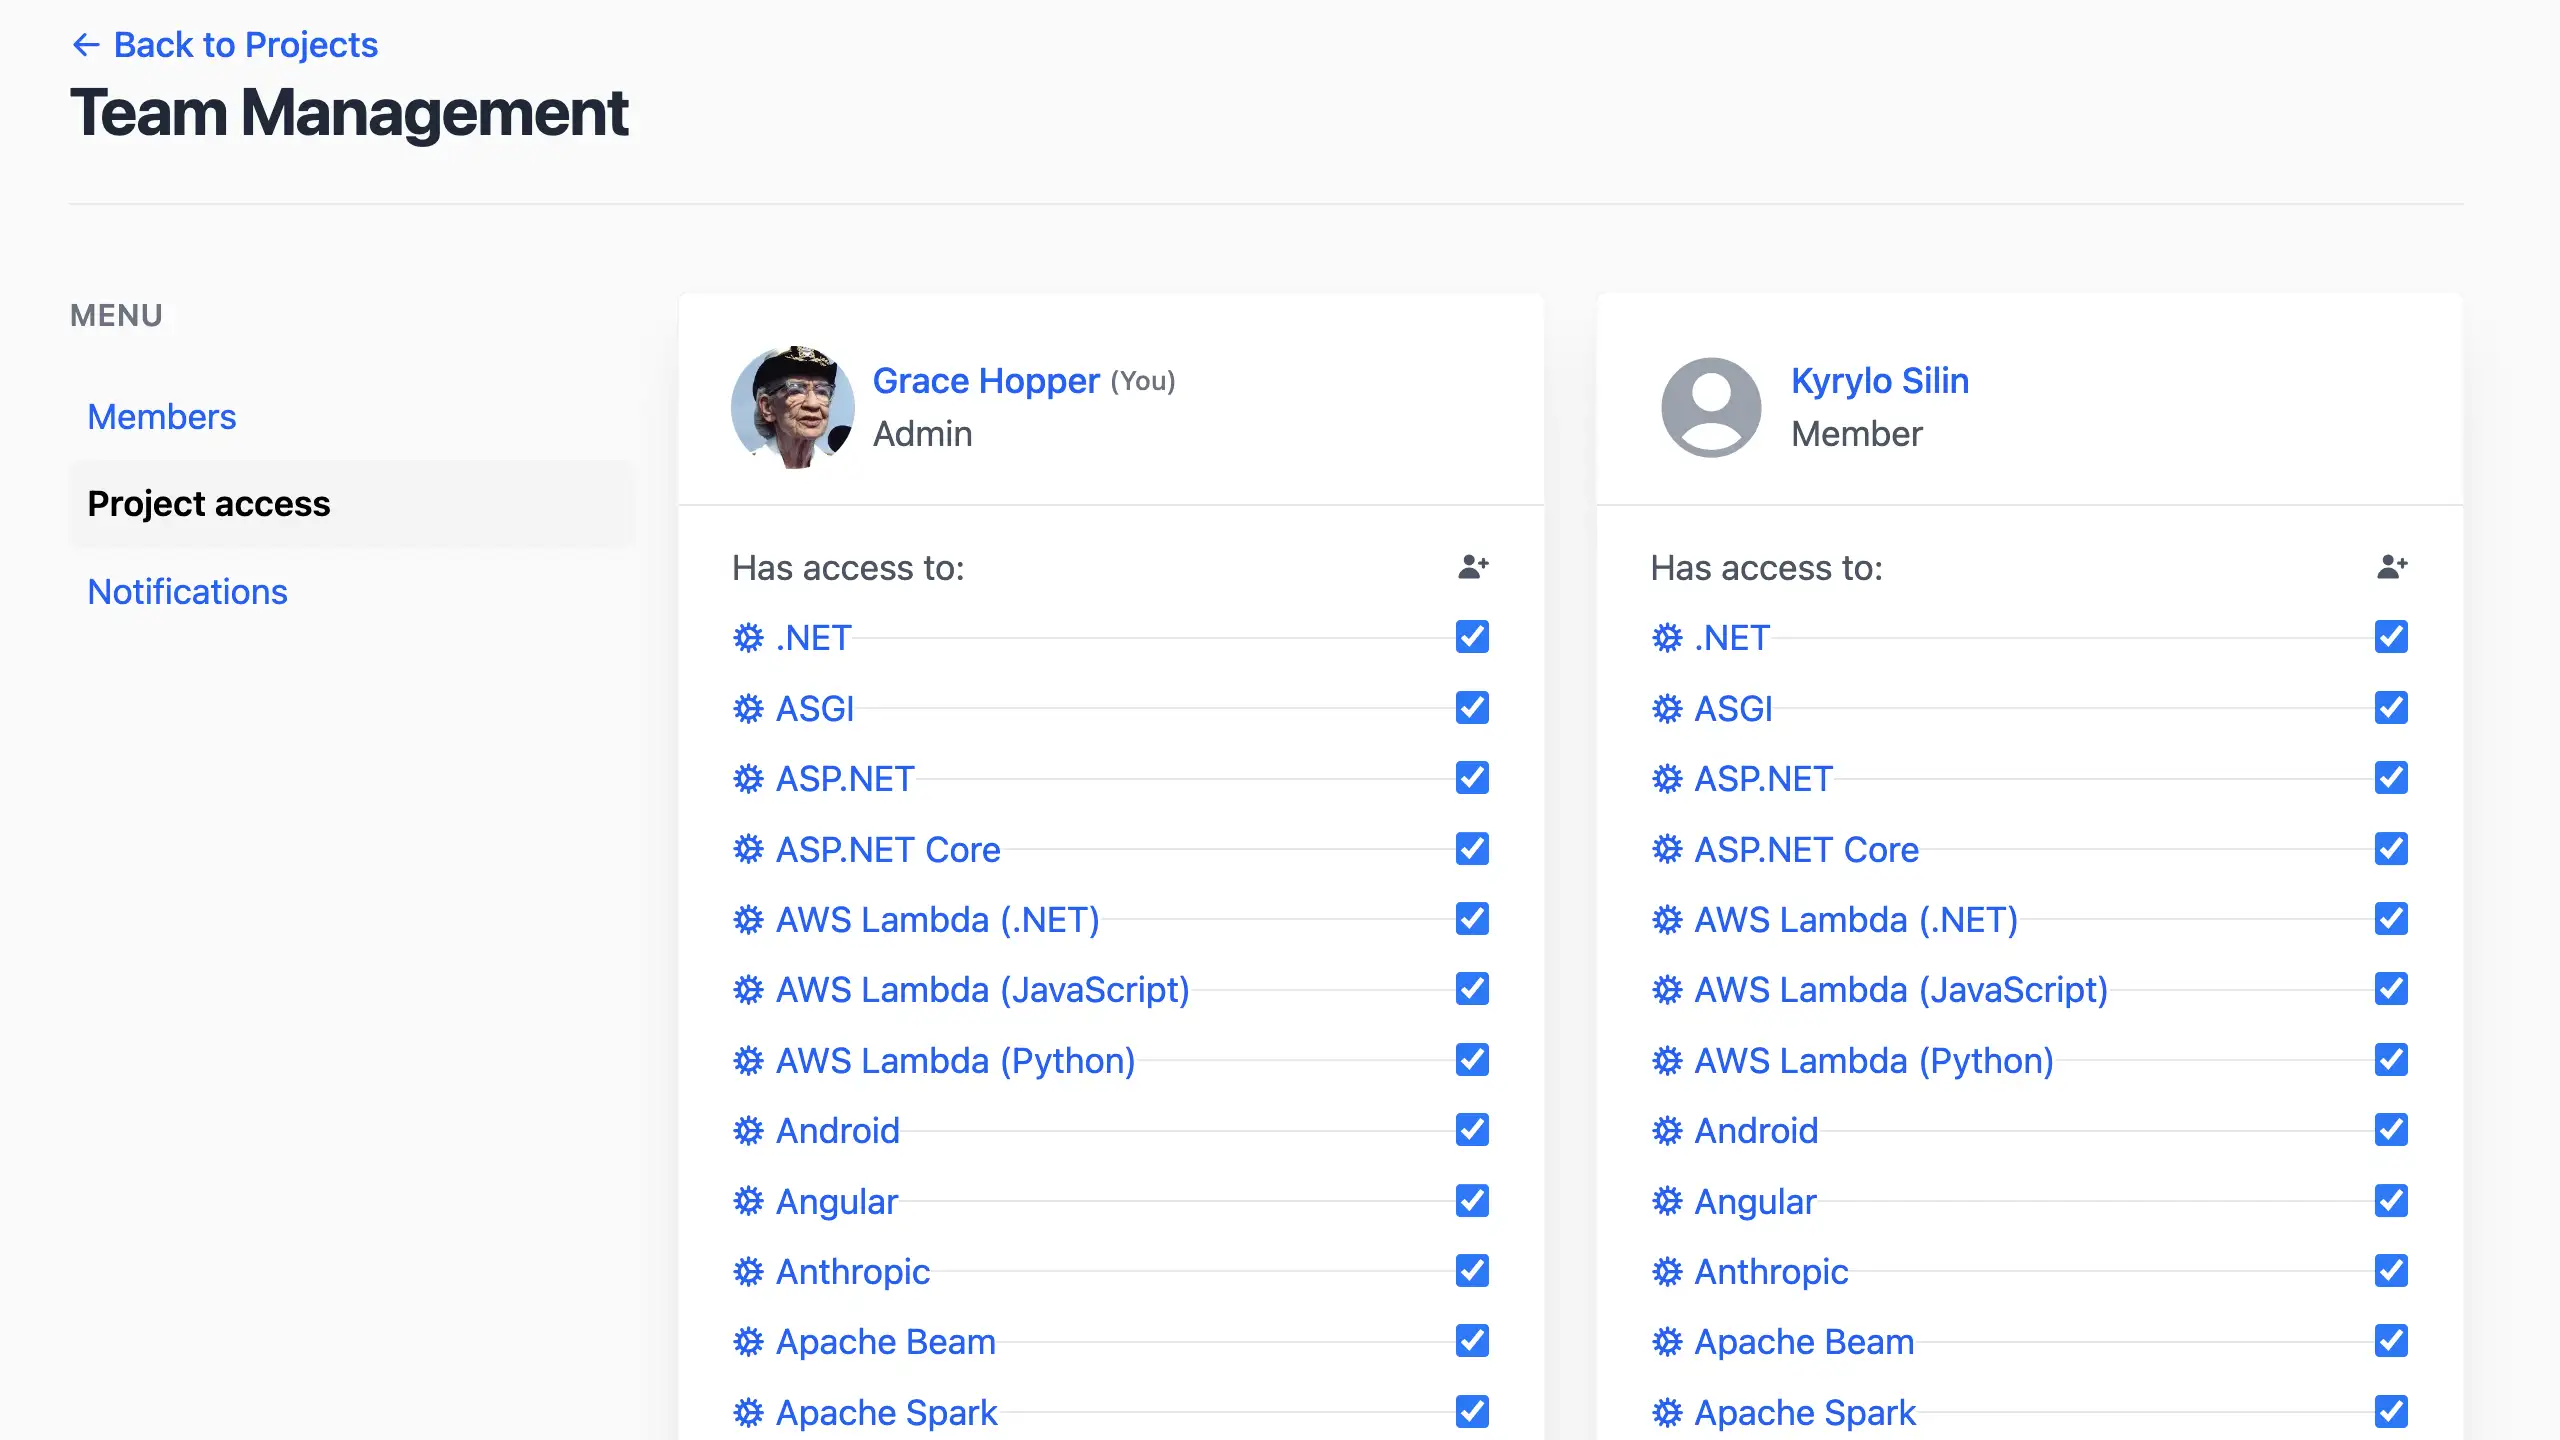
Pro tip: Use this for segmented teams, like devs on backend projects only. Review periodically to keep access current.
8.8 Team notifications 
Keep the team alerted without overwhelming inboxes — admins can control the flow.
- Go to Team Management > Notifications.
- Check boxes for projects where users should get email pings (unchecked skips them).
- Focuses on email; other channels (like Slack) are separate.
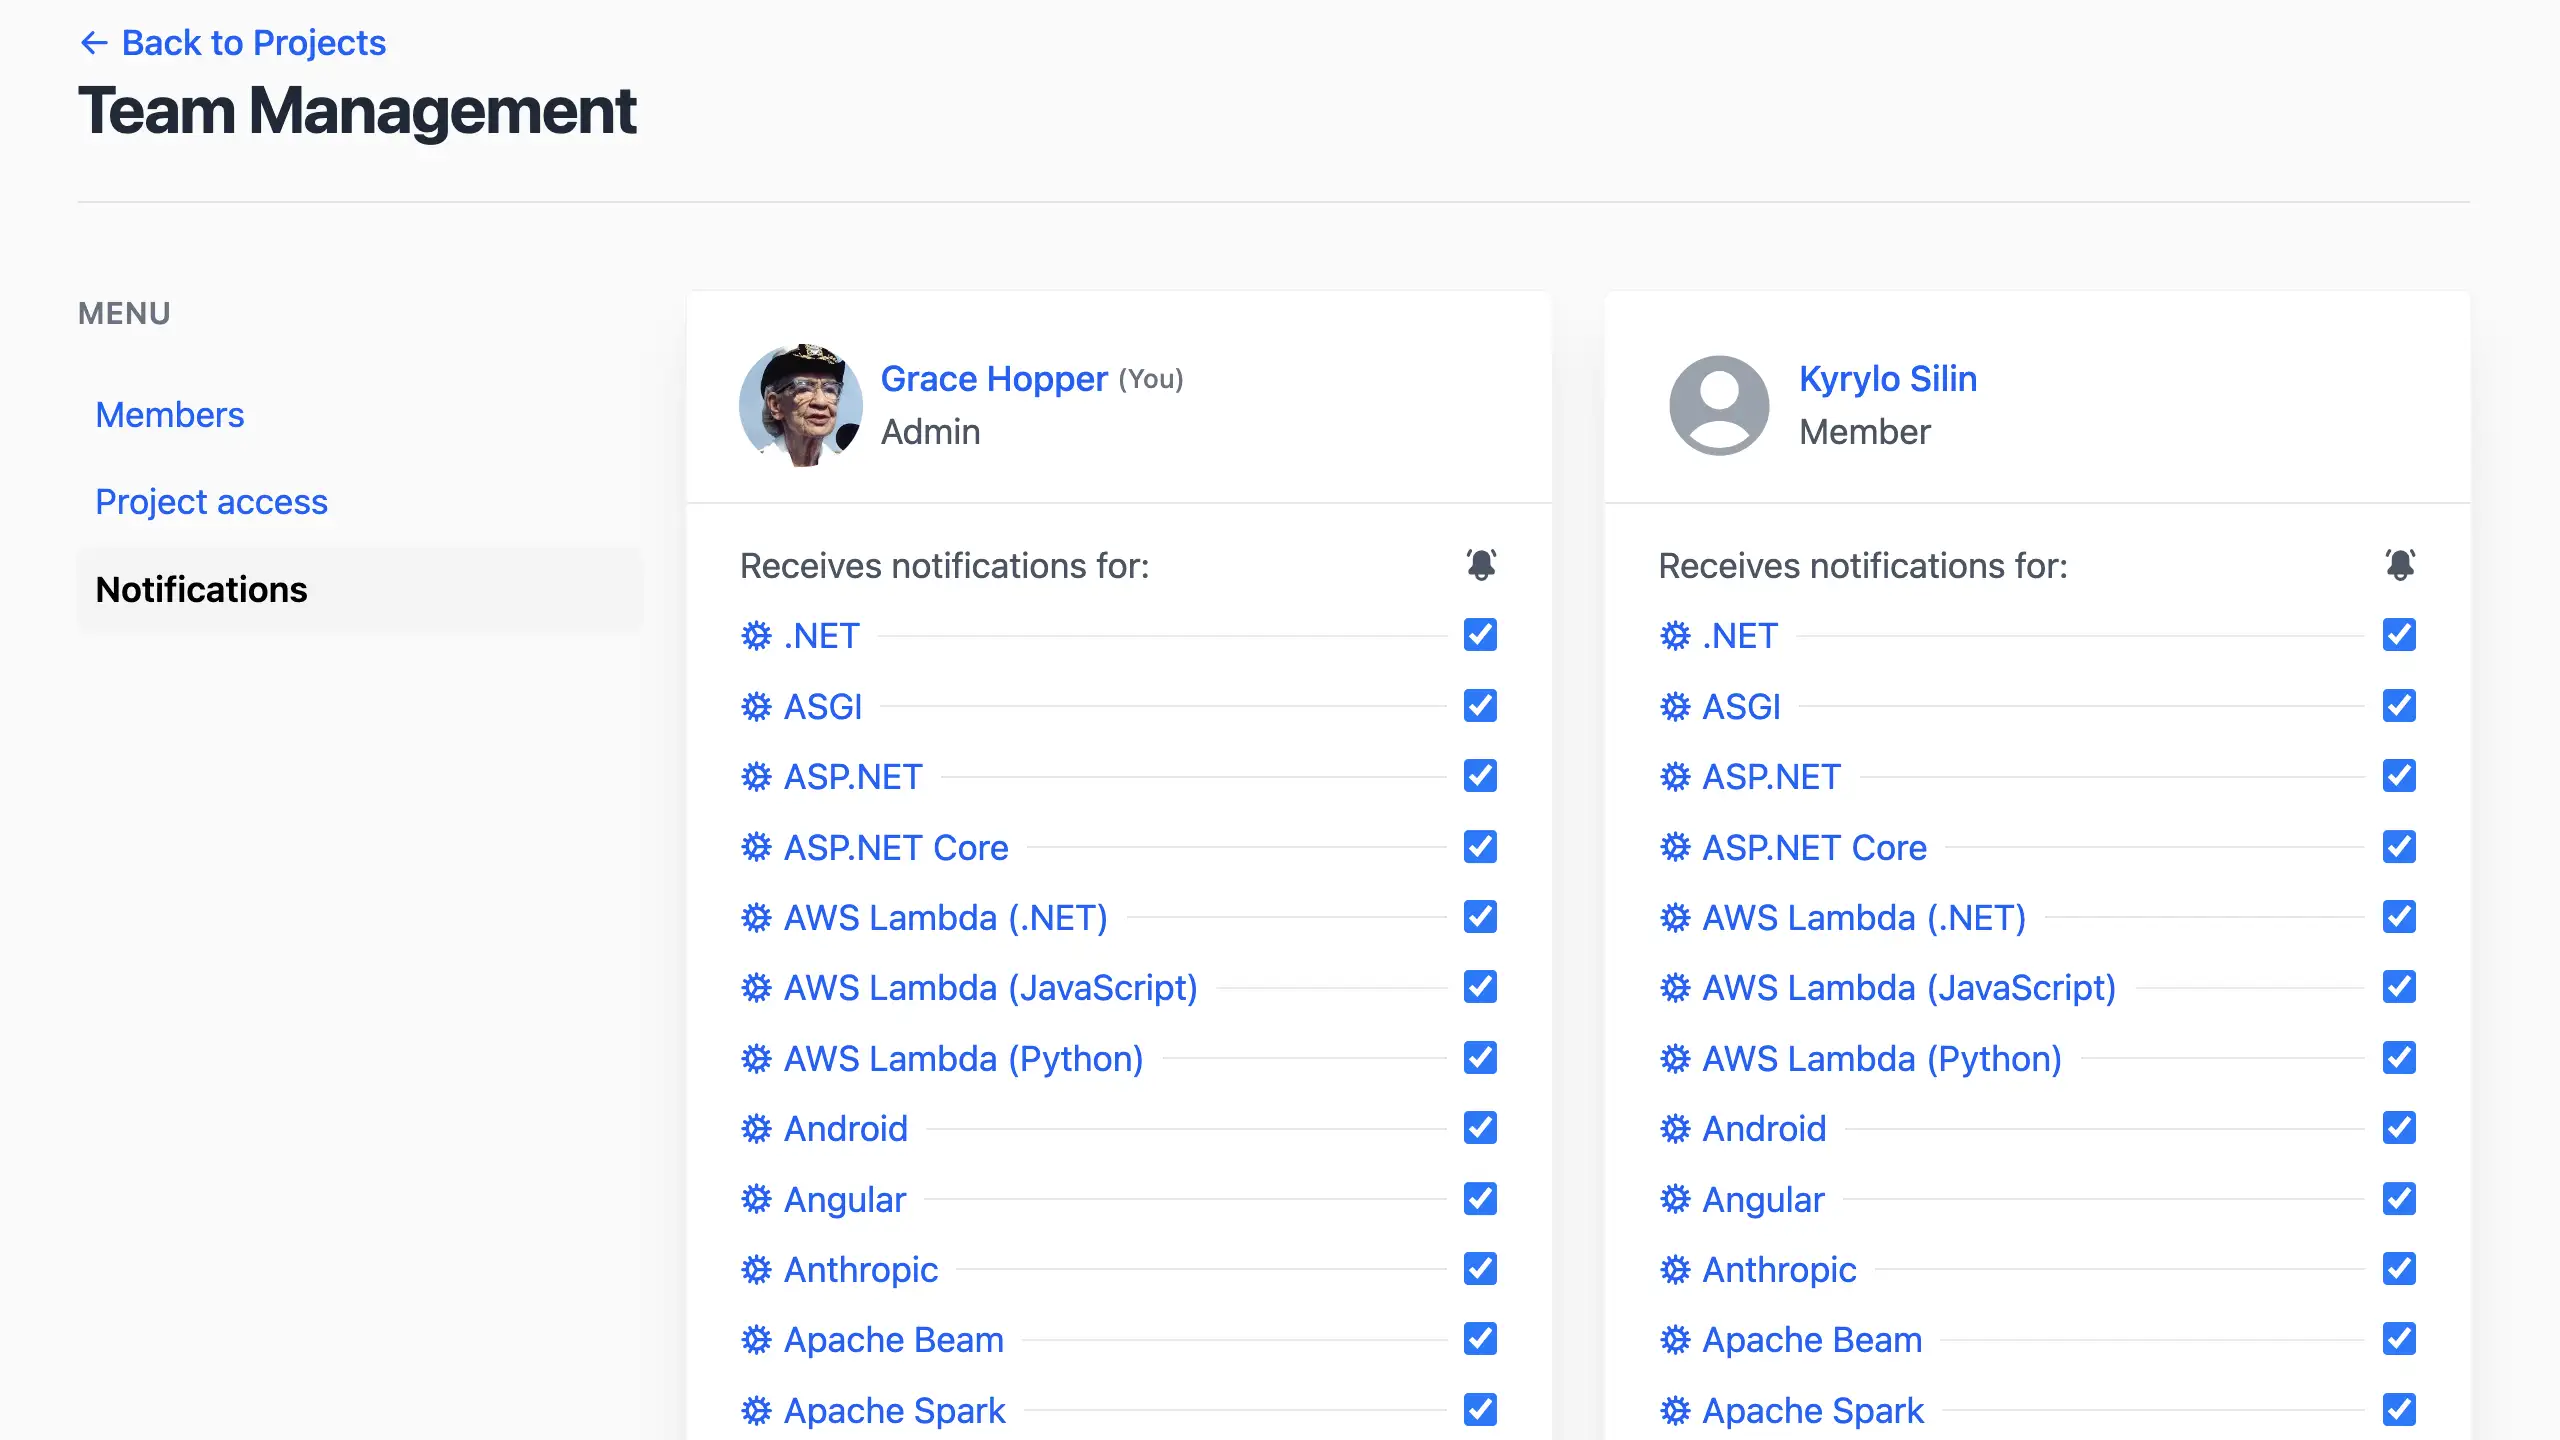
Fun twist: Tailor this for on-call rotations — enable for critical projects only. Combine with personal settings for ultimate customization.
Next steps 
Team assembled? Great! Now check out Project settings to customize per project, or explore Notifications settings for advanced alerts. Remember, a well-managed team turns bug hunting into a group adventure — happy collaborating!
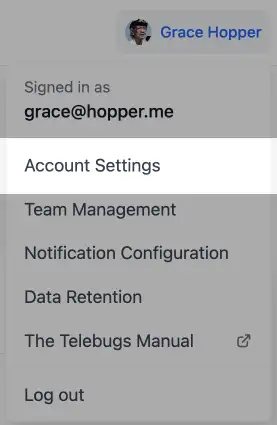
9 Account settings 
Your Telebugs account is your command center for managing how you interact with the platform. From personalizing your profile to securing your access, the Account Settings section is where you make Telebugs truly yours. Whether you’re tweaking your profile picture, locking down your API key, or updating your email, this is your one-stop shop for all things account-related. To jump in, click your profile icon in the top-right corner of the Telebugs dashboard and select Account Settings from the dropdown. Ready to take control? Let’s walk through each part with some flair and practical tips.
- Profile picture
- Changing your name
- Security settings
- Log in on another device
- Notification preferences
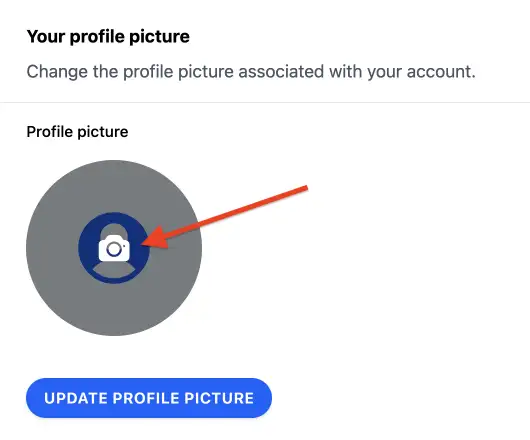
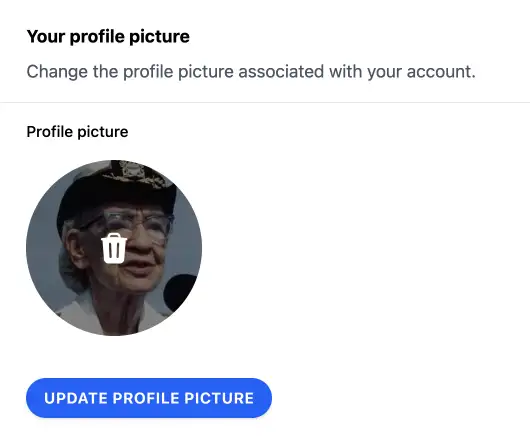
9.1 Profile picture 
Your profile picture is your digital handshake — it’s what your team sees next to your name across Telebugs. Make it pop with a photo that screams "you" (or at least makes you recognizable in a team meeting!).
Uploading a profile picture 
Want to swap out that generic avatar for something with personality? Here’s how:
- Click the default profile picture in the Account Settings page.
- Pick an image file from your device — something clear, ideally square.
- Hit the Update profile picture button to lock it in.
Pro tip: Choose a high-res image for crisp display. It’ll show up everywhere, from comments to team lists, so make it count!
Deleting a profile picture 
Decided to go incognito? No problem. To ditch your profile picture:
- Click your current picture in Account Settings.
- Select the option to remove it and confirm with the Update profile picture button.
This reverts you to the default avatar — clean and simple. Perfect if you’re feeling minimalist or just want a reset.
9.2 Changing your name 
Your name appears across Telebugs — in team lists, comments, and wherever your contributions are shown. Keep it current and professional for easy team recognition.
Updating your display name 
To update how you appear to your team:
- Navigate to the Your name section in Account Settings.
- Enter your new name in the Full name field.
- Click Change name to save your changes.
There are no limits on name length or characters — use whatever works best for your team. Unicode characters, emojis, and special symbols are all supported. Your updated name takes effect immediately across all Telebugs interfaces.
9.3 Security settings 
The Security tab is your fortress for keeping your account safe. From API keys to email updates, this is where you tighten the bolts on your Telebugs access. Navigate to Account Settings and click the Security tab to get started.
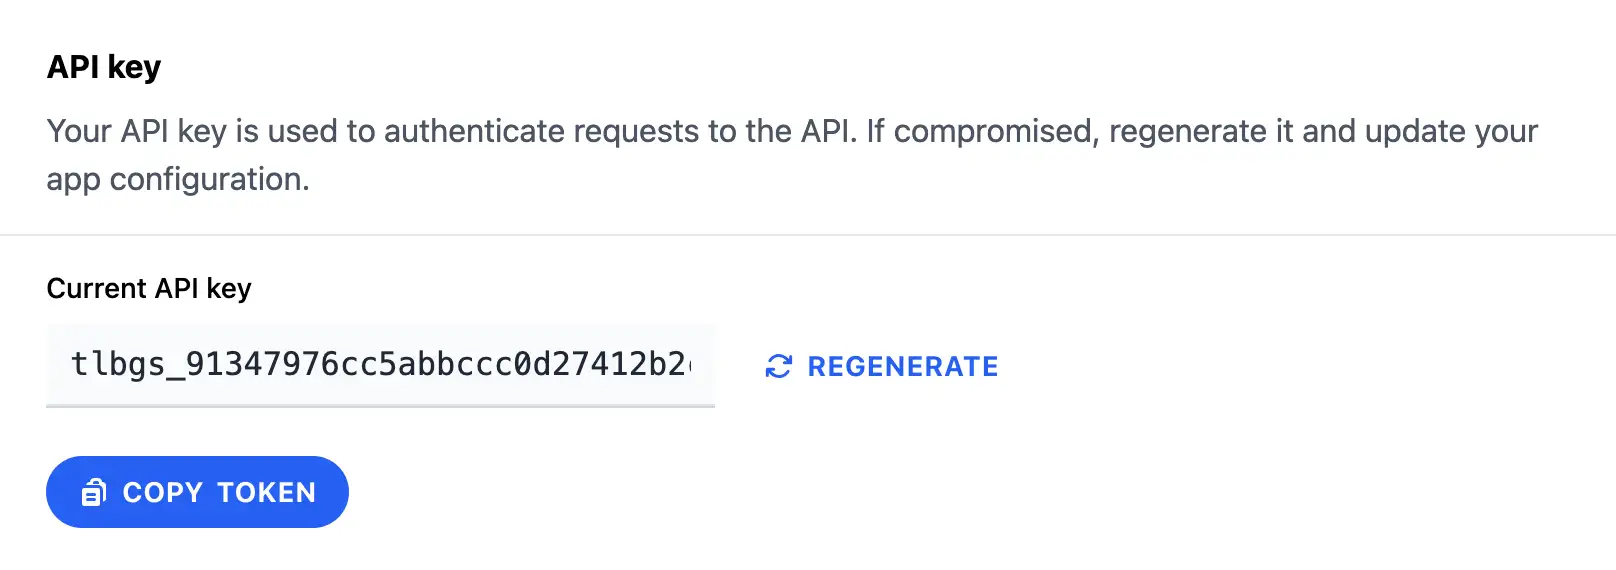
9.3.1 Regenerating your API key 
Your API key is the golden ticket for interacting with Telebugs programmatically. If it’s compromised (or you just want a fresh one), regenerating is quick and keeps things secure. Here’s the playbook:
- Head to the API key section in Security settings.
- Click the Regenerate button — old key’s toast!
- Use the Copy token button to grab the new key and update your app’s config ASAP.
Quick tip: Store your API key in a secure vault or environment variable, not in your codebase. After regenerating, test your integration to ensure reports are flowing. No reports? Check that new key!
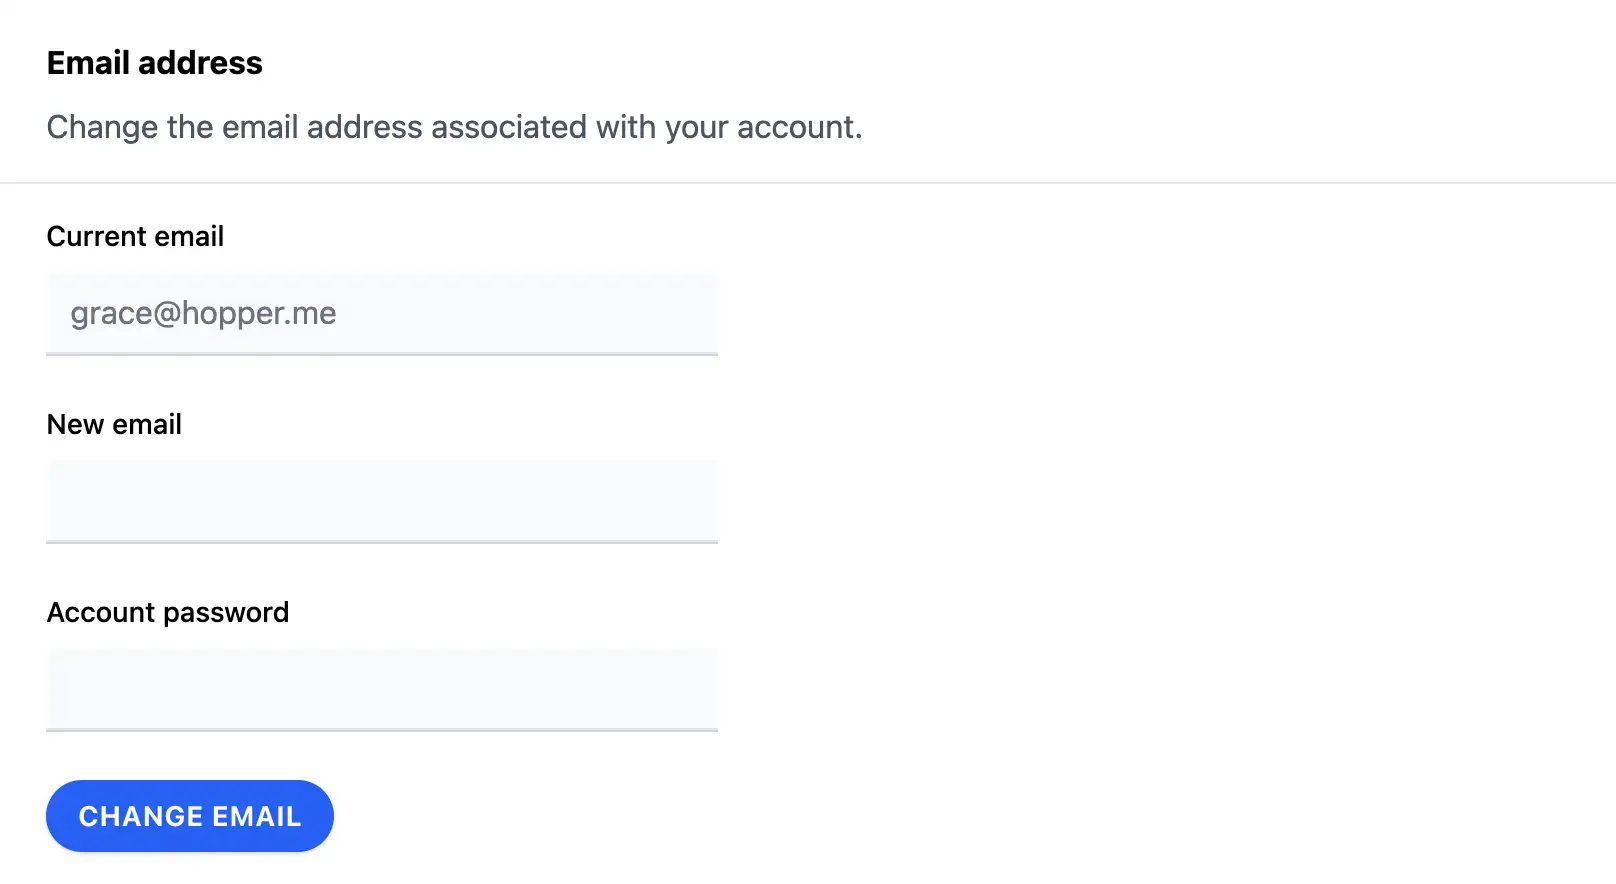
9.3.2 Changing your email address 
Need to switch the email tied to your account? Maybe you’re moving to a new domain or just want a fresh inbox. It’s straightforward:
- Scroll to the Email address section in Security settings.
- Enter your new email and confirm your current password for security.
- Click Change email to seal the deal.
Heads-up: You’ll likely need to verify the new email via a confirmation link. Keep an eye on your inbox (and spam folder) to complete the switch. This ensures notifications and resets go to the right place.
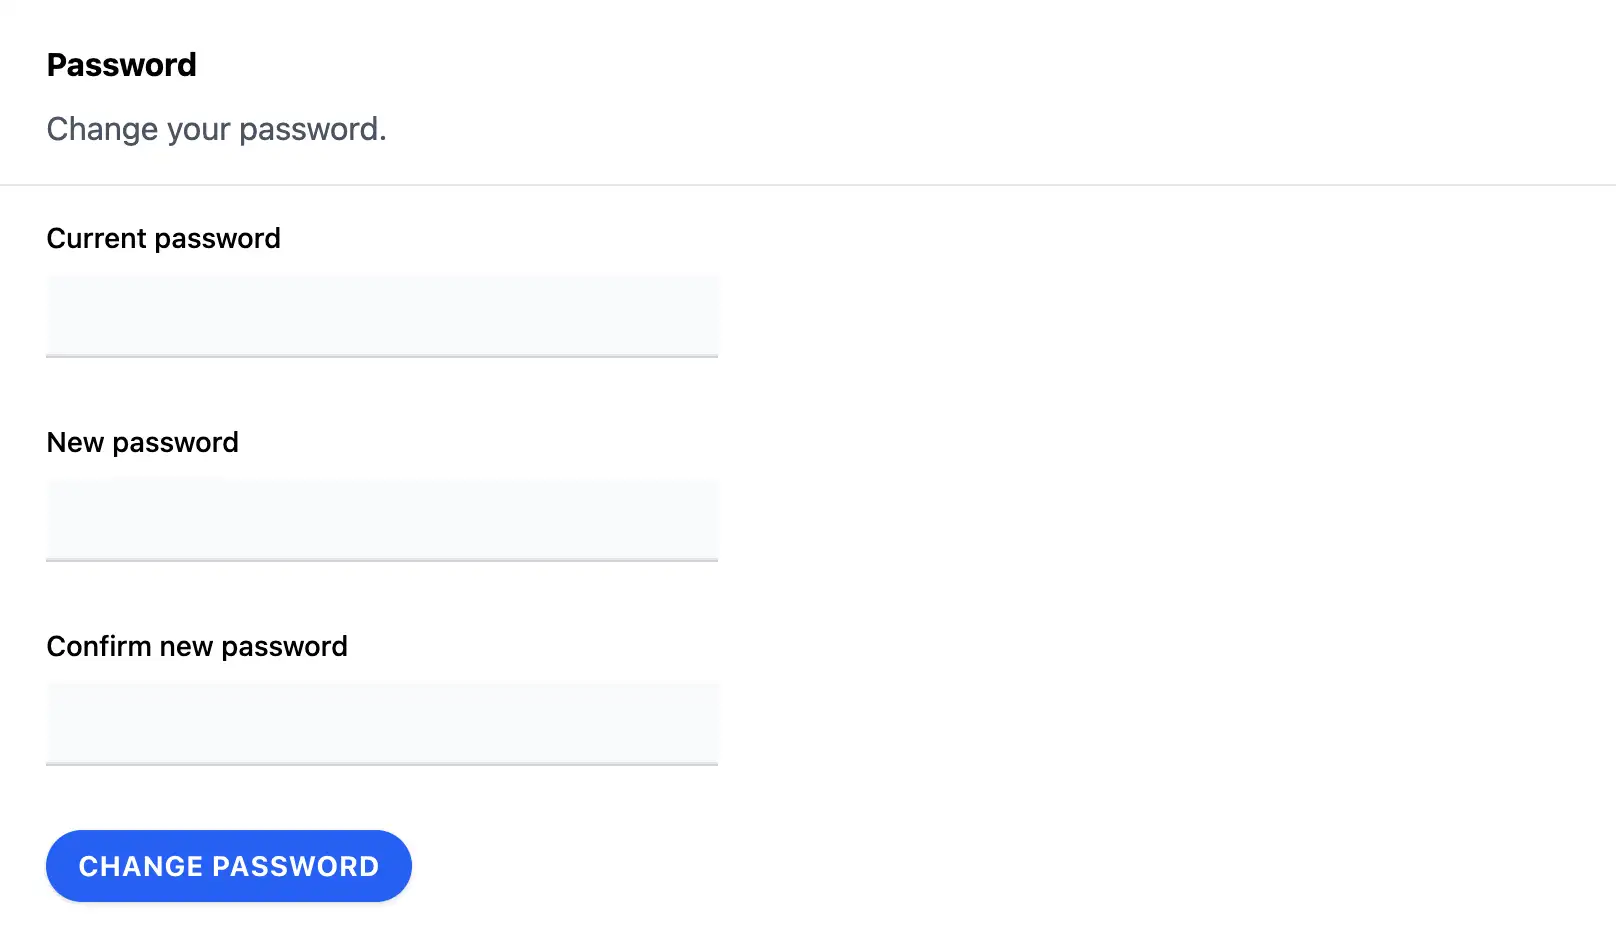
9.3.3 Changing your password 
Keep your account locked tight with a strong password. Updating it regularly (or after a security scare) is a smart move. Here’s how:
- Navigate to the Password section in Security settings.
- Enter your current password, then type and confirm your new one.
- Click Change password to make it official.
Pro tip: Use a unique, complex password (mix letters, numbers, symbols). A password manager can help. Test logging in after the change to confirm it worked. Locked out? Ask your admin for a sign-in link.
9.4 Log in on another device 
Need to access Telebugs from a new device or browser? Generate a secure sign-in link that bypasses the usual login process. This feature is perfect for quickly switching between devices or recovering access when locked out.
Generating a sign-in link 
Your personal sign-in link provides instant access to your account:
- Navigate to the Sessions tab in Account Settings.
- Find the Log in on another device section.
- Use the Copy link button to grab your secure URL.
- Open the link on your target device to log in instantly.
Security note: This link expires after 4 hours and is tied specifically to your account. Never share it with anyone — it grants full access to your Telebugs account. If compromised, simply generate a new one by refreshing the page.
9.5 Notification preferences 
Control which projects send you error notifications. This helps you stay focused on the projects that matter most while avoiding notification overload from less critical applications.
Managing project notifications 
Fine-tune your notification settings per project:
- Navigate to the Notifications tab in Account Settings.
- Review the list of all projects you have access to.
- Toggle notifications on or off for each project using the checkboxes.
- Changes save automatically.
Each project shows its platform icon and name for easy identification. When notifications are enabled for a project, you’ll receive alerts for new errors, critical issues, and other important events.
10 Notifications 
Telebugs supports multiple notification channels to keep you informed about new error reports in real time. The available channels are:
- Email: Receive error notifications directly in your inbox.
- Push notifications: Get instant notifications on your mobile or desktop device.
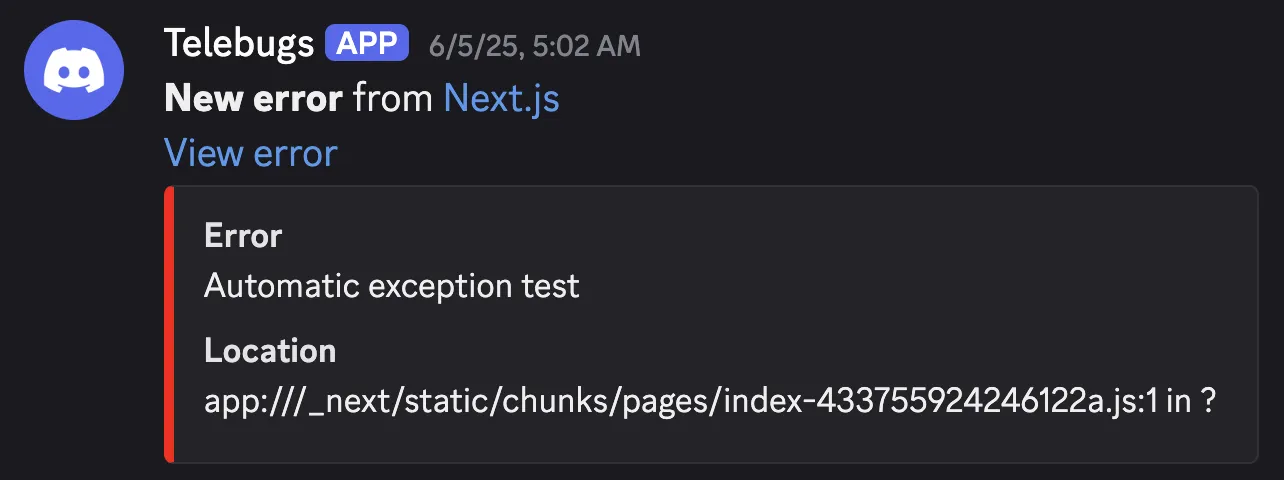
- Webhooks: Integrate with external services — such as Slack, Discord, or custom endpoints — for automated notifications.
This chapter explains how to configure each notification channel to match your workflow.
10.1 Email 
To receive error notifications via email, you must first configure global email settings.
Individual projects can disable email notifications in their project settings, and each user can opt out in their profile settings. Once global email notifications are configured, project-level rules determine when you will be notified.
Email notifications are sent to the address associated with your Telebugs account.
If you need notifications sent to a different address, update your email in your profile.
You can choose to receive notifications based on the following conditions:
- Notify when a new error occurs for the first time.
- Notify when an error reoccurs after being resolved.
- Notify when error frequency exceeds a threshold (for example, more than 10 reports in 5 minutes).
Follow these steps to configure email notifications:
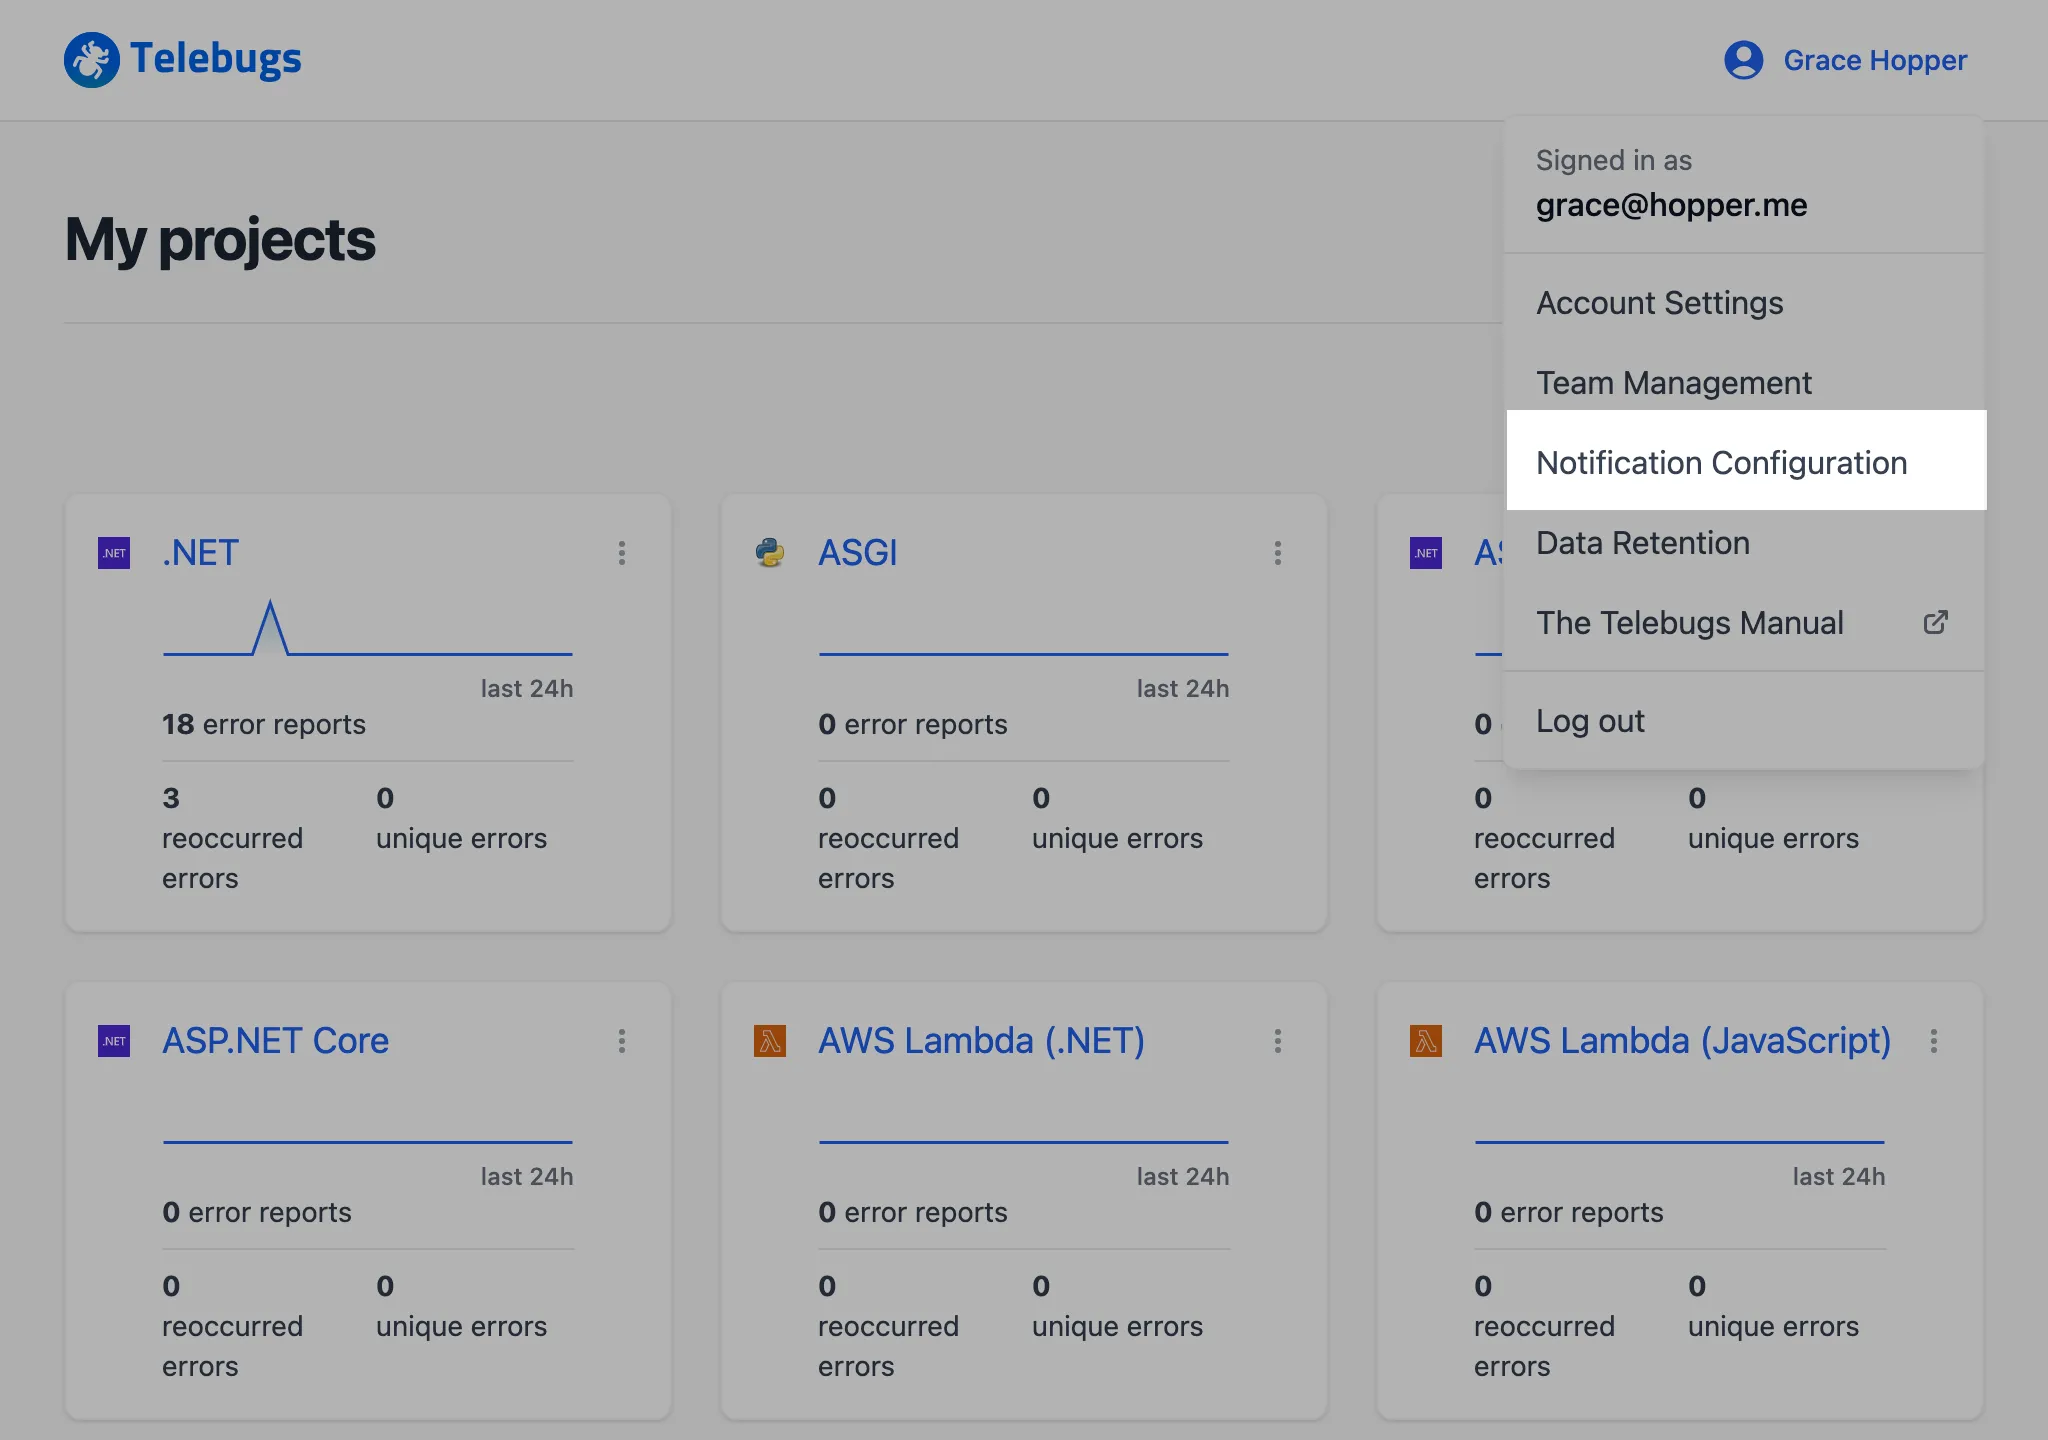
- Open the menu in the top-right corner, click your profile name, and select
Notification Configuration.

- In the sidebar on the left, ensure that Email is selected.
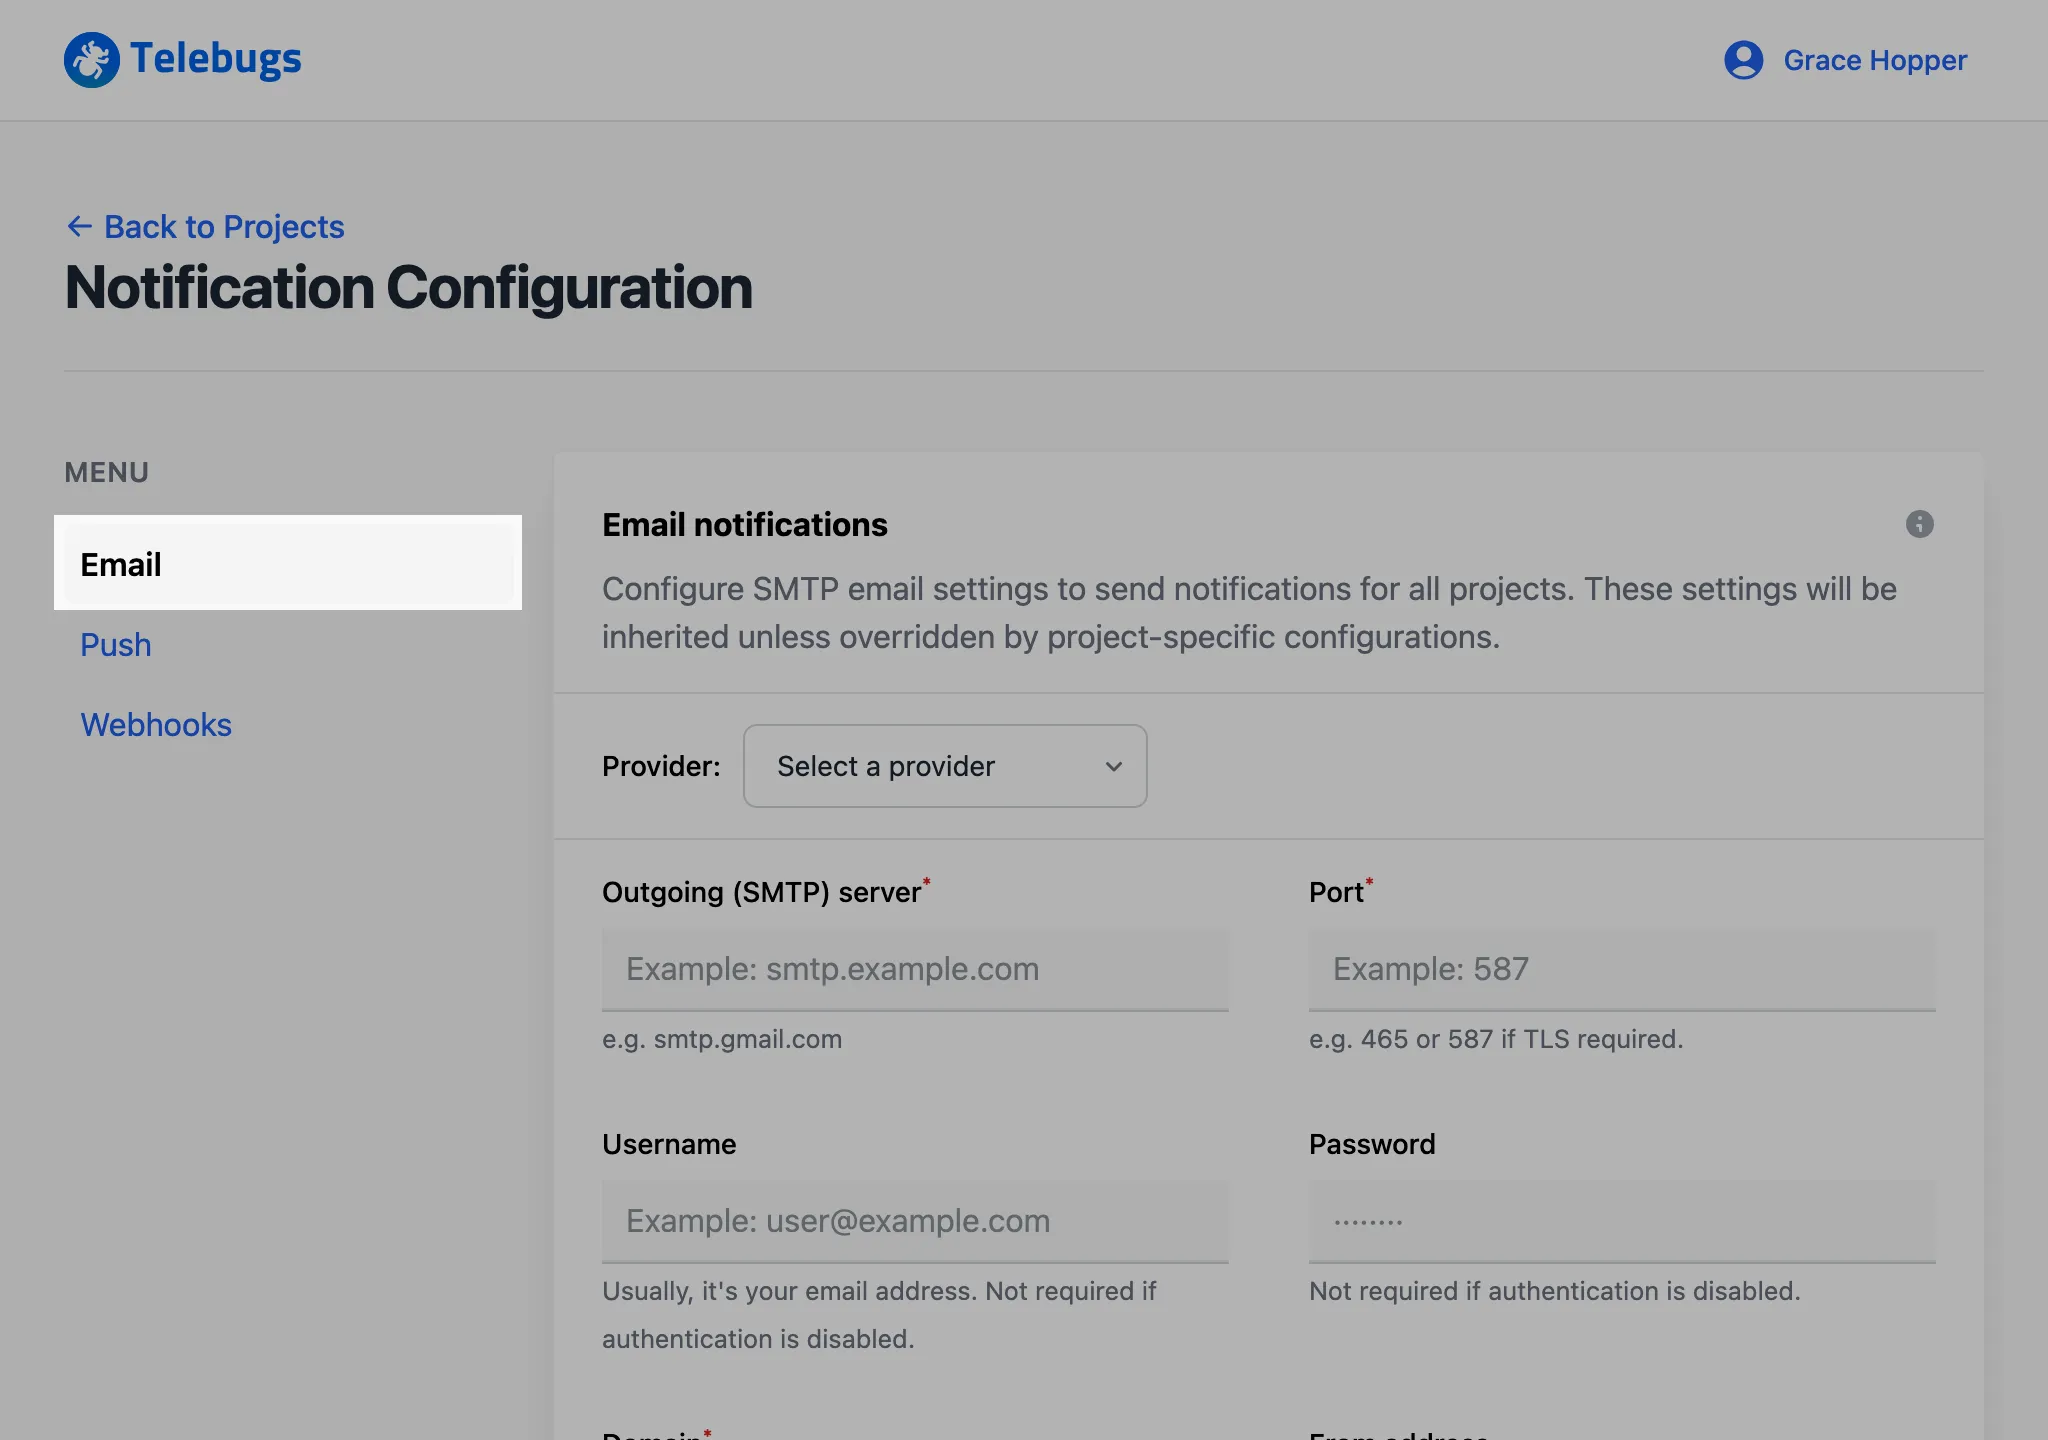
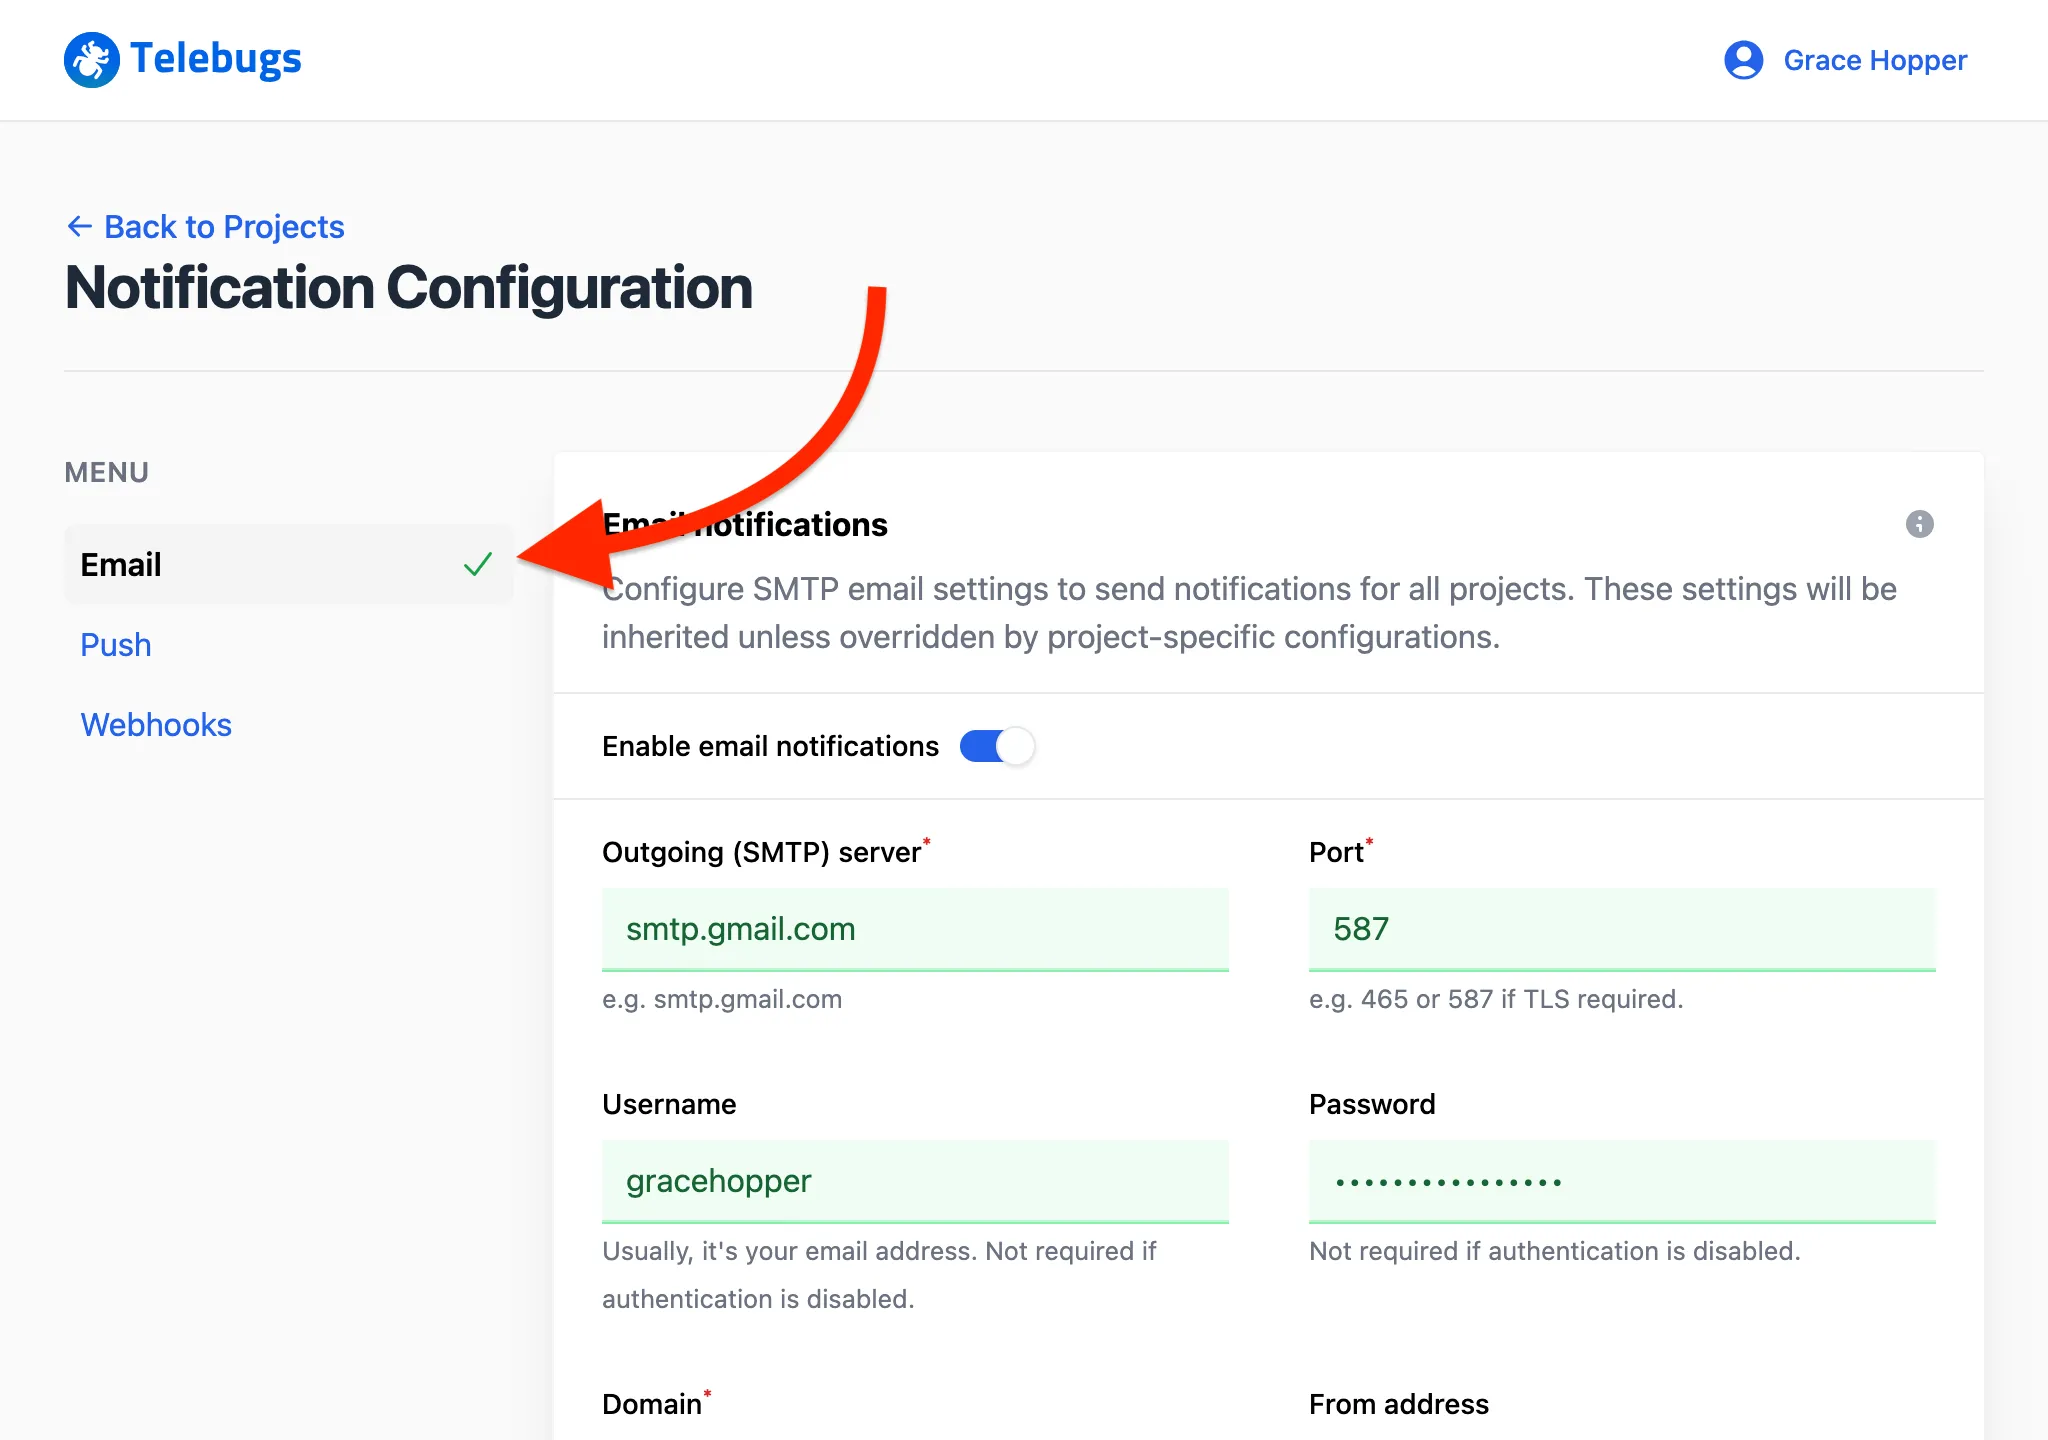
- Complete the Email notifications configuration form, then click Save Configuration to apply your settings.
- Once the form is saved, a green checkmark appears next to Email
in the sidebar, indicating that email notifications are configured.
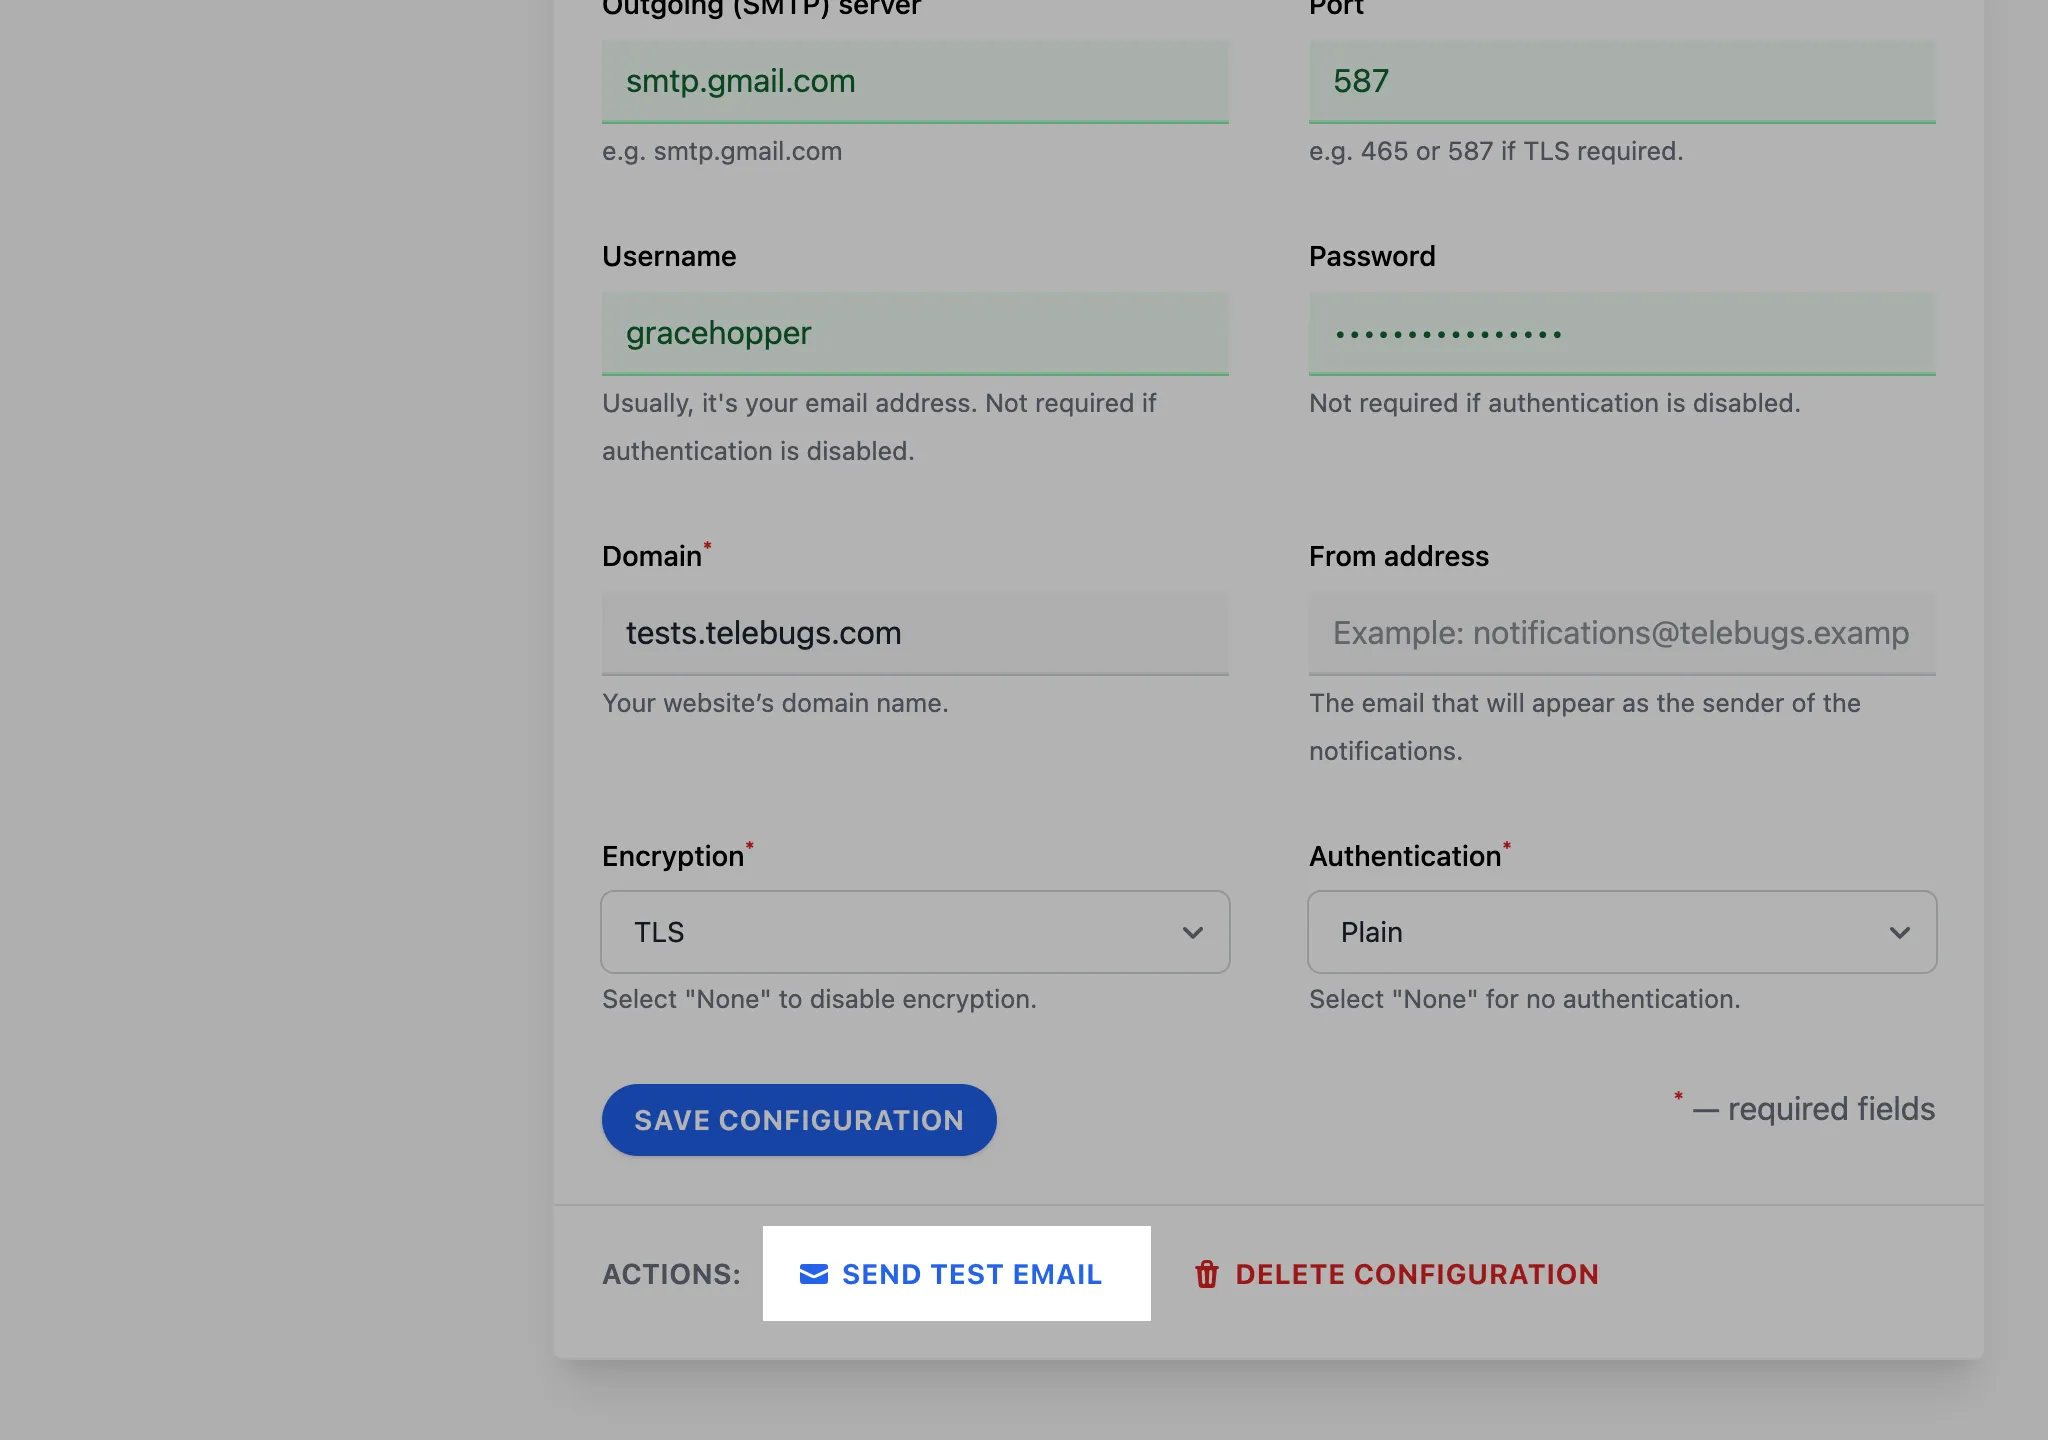
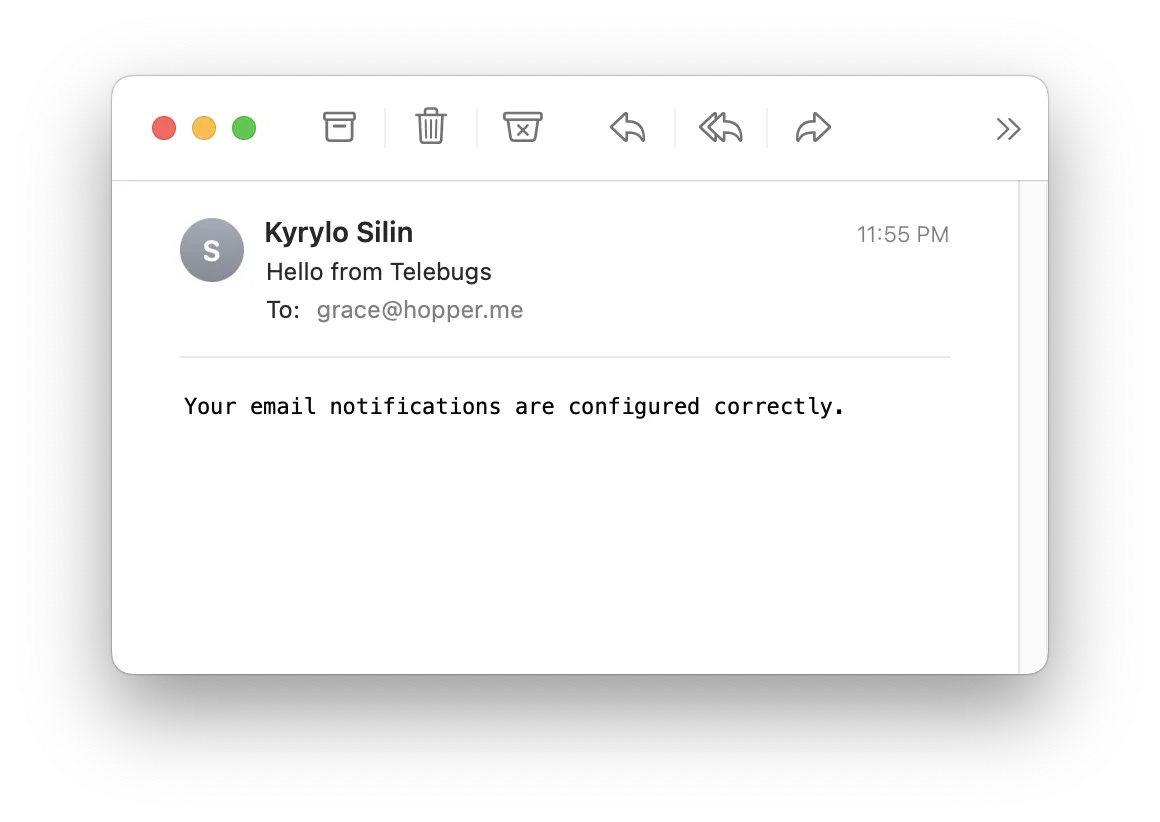
- Click the Send test email button to verify that notifications
work.
- A confirmation toast appears, showing that the test email has been sent.
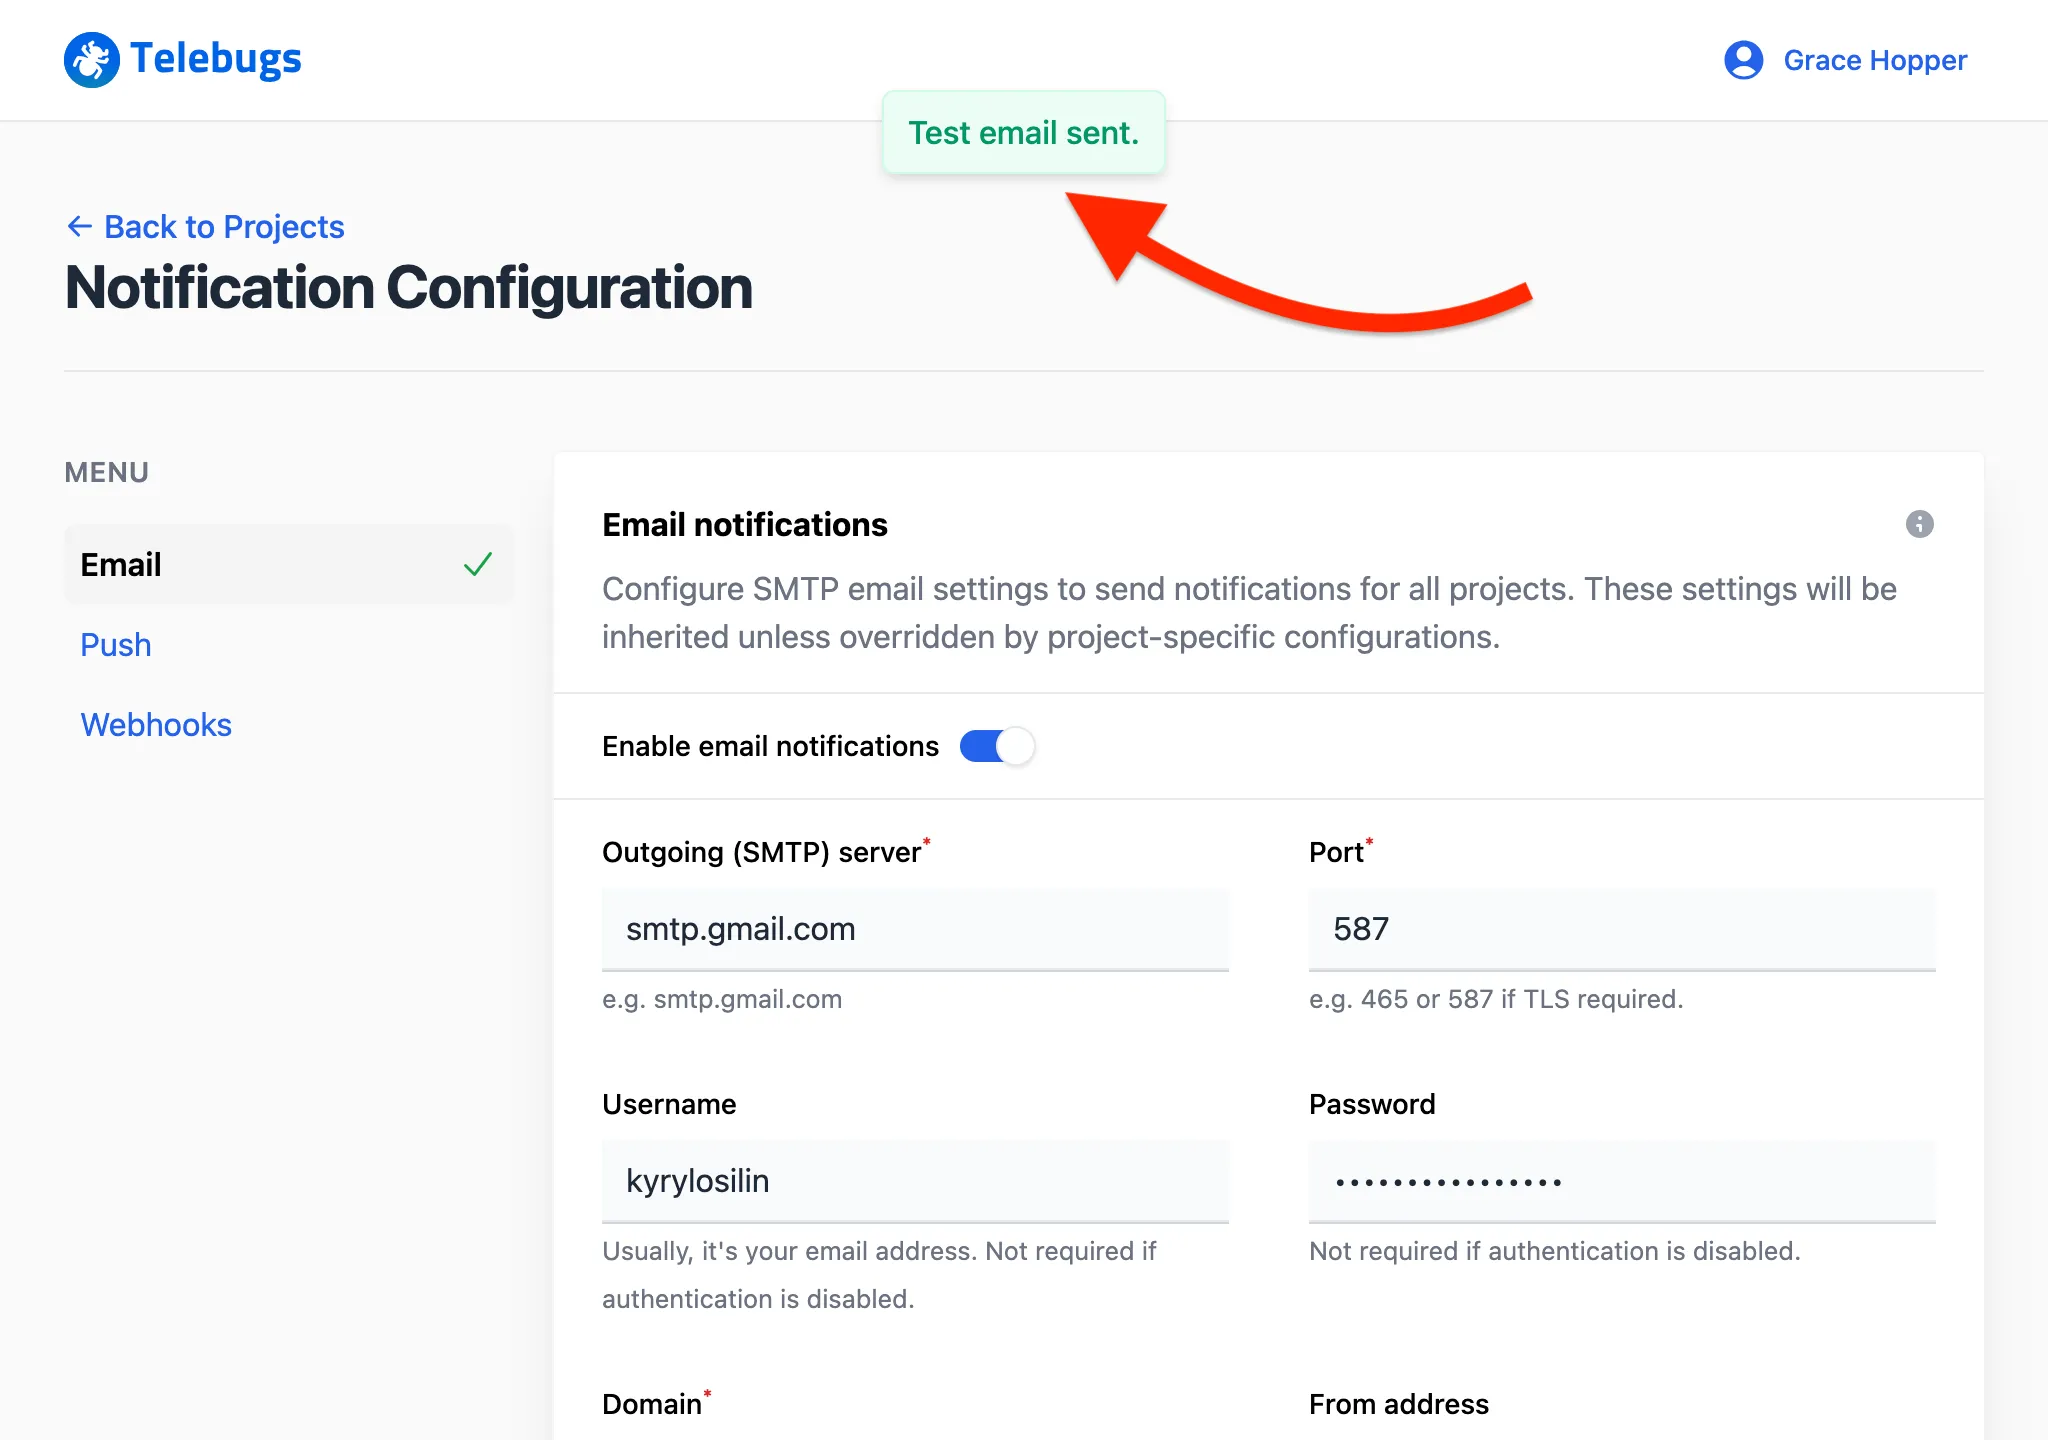
- Check your inbox; you should receive a test email at the address
associated with your Telebugs account.
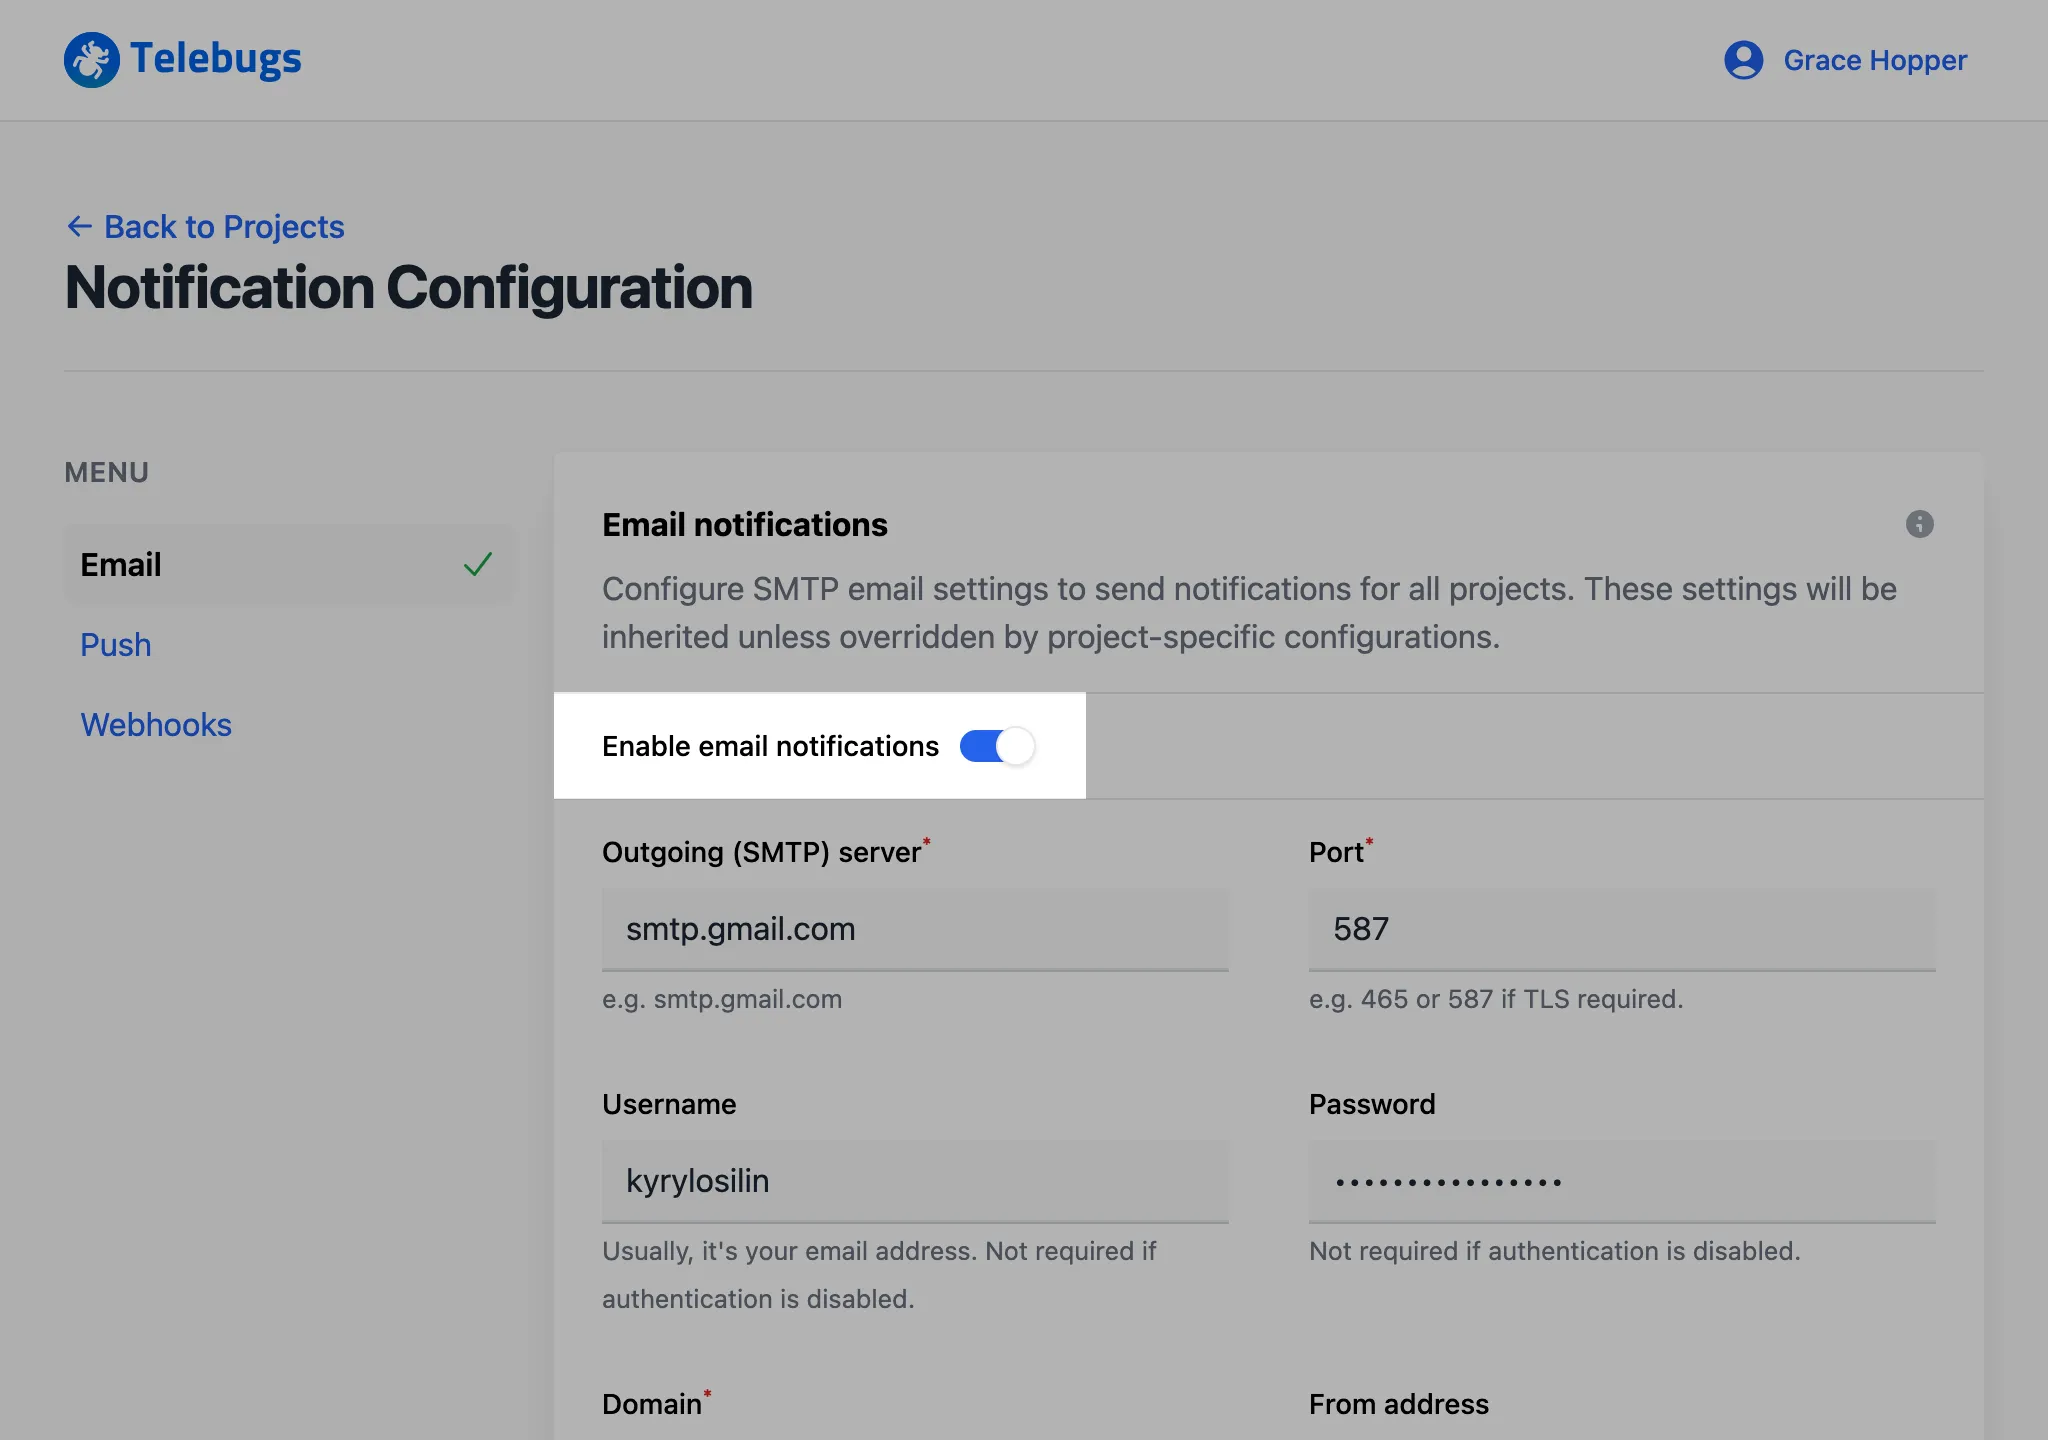
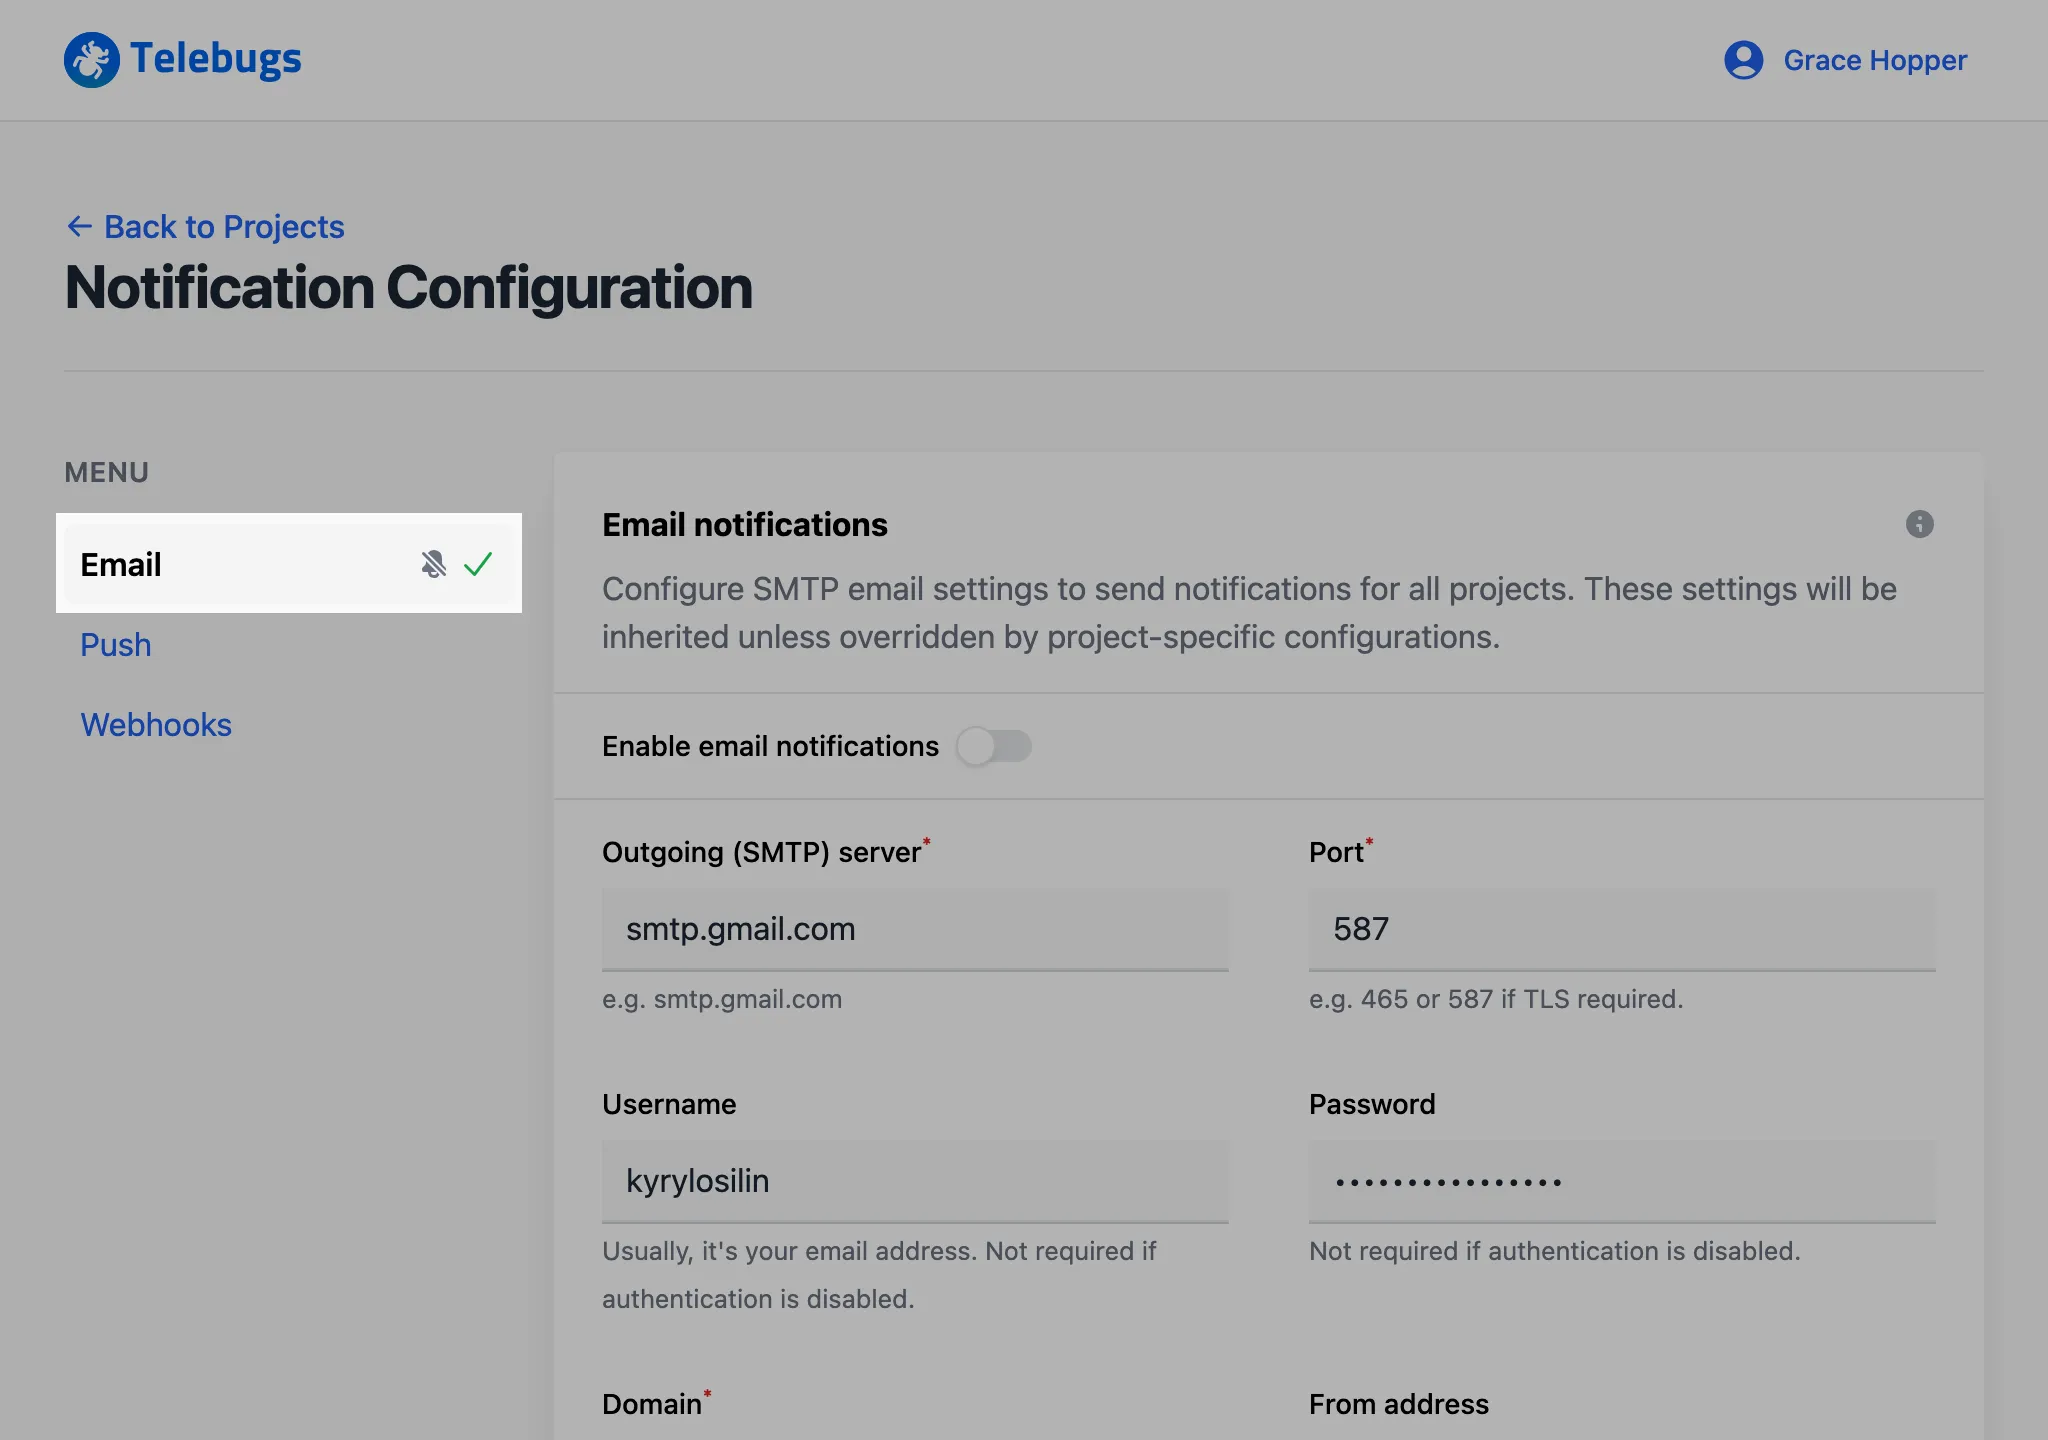
- To disable all email notifications, toggle off Enable email
notifications.
The sidebar icon will change to a bell with a slash, indicating that email
notifications are disabled.
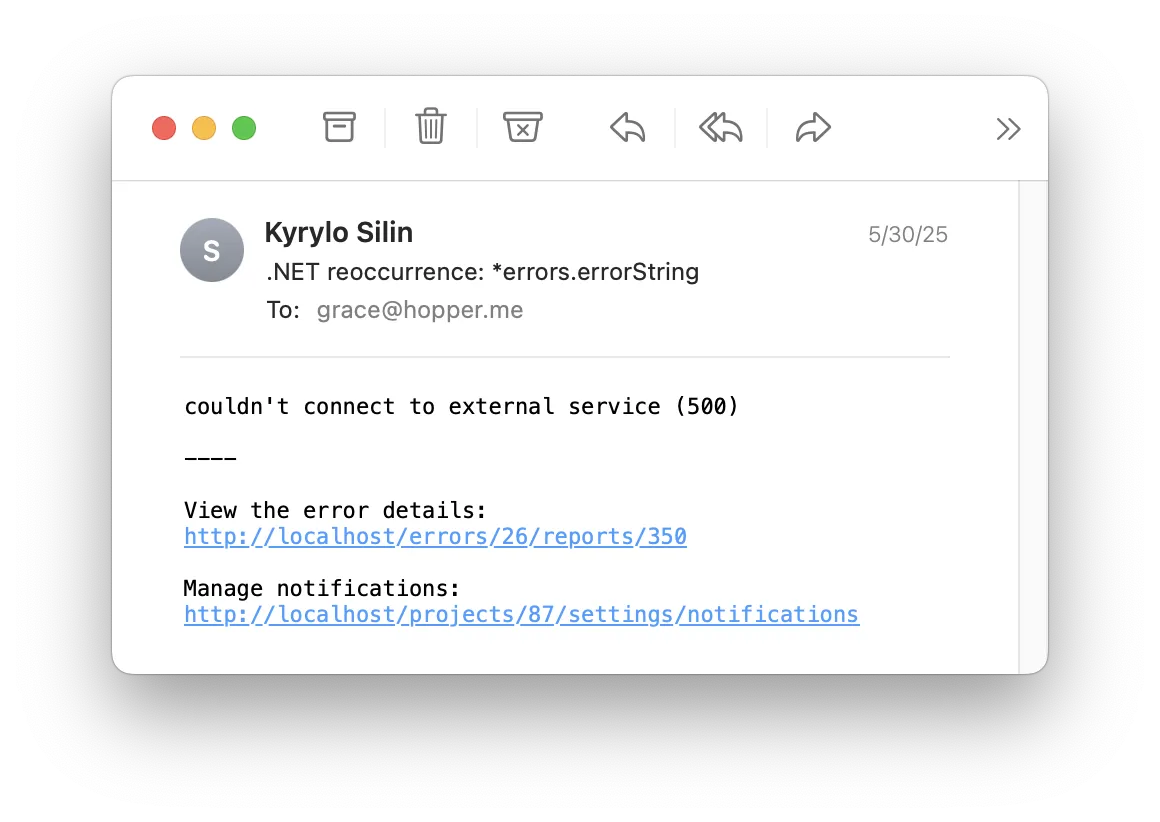
- When a real error occurs, you will receive an email according to the rules
you configured in project settings. The email includes details such as the
error message and a link to the error report in Telebugs.
Email notifications configuration form 
The Email notifications configuration form defines global settings that all projects inherit. Complete the fields as follows:
- Provider: Select your email provider from the dropdown. Telebugs supplies preset configurations for common providers (Gmail, Outlook, etc.). Choose Custom SMTP to enter your own server settings manually.
- Outgoing (SMTP) server: Enter the SMTP server address used to send emails (for example, smtp.gmail.com for Gmail). This field is required.
- Port: Specify the port number for the SMTP server. Typically 587 (TLS) or 465 (SSL). This field is required.
- Username: Enter the username for your SMTP server — usually your email address or the username provided by your email service. Leave blank if authentication is not required. Required if your provider requires login.
- Password: Enter the password for your SMTP account. Leave blank if authentication is not required. Required if your provider requires login.
- Domain: The HELO domain used by the SMTP server (for example, example.com). This field is required.
- From address: The email address that appears as the sender of notification emails. Commonly, a no-reply address. Optional.
- Encryption: Select the encryption method for the SMTP connection: None, SSL, or TLS. This field is required.
- Authentication: Specify if SMTP authentication is required: None, Login, or Plain. If you choose an option other than None, you must provide a username and password. This field is required.
10.2 Push notifications 
Once you save these settings, Telebugs will send notification emails according to the project-level rules you configured earlier. To receive error notifications via push notifications, you must first configure global push notification settings. Individual projects can disable push notifications in their project settings, and each user can opt out in their profile settings. Once global push notifications are configured, project-level rules determine when you will be notified. Push notifications are sent to devices where you have allowed notifications for Telebugs. This can include desktop browsers (like Chrome or Firefox) and mobile devices with the Telebugs Progressive Web App (PWA) installed. To enable notifications, you’ll need to grant permission on each device you use — typically through a browser prompt or your device’s notification settings.
Note: For mobile devices, installing the Telebugs PWA can enhance the notification experience. For a quick guide on installing the PWA, See Installing Telebugs as a Progressive Web App (PWA).
You can choose to receive notifications based on the following conditions:
- Notify when a new error occurs for the first time.
- Notify when an error reoccurs after being resolved.
- Notify when error frequency exceeds a threshold (for example, more than 10 reports in 5 minutes).
Note: Push notifications require your permission to be sent. You may be prompted to allow notifications when you configure them or when you visit your Telebugs instance.
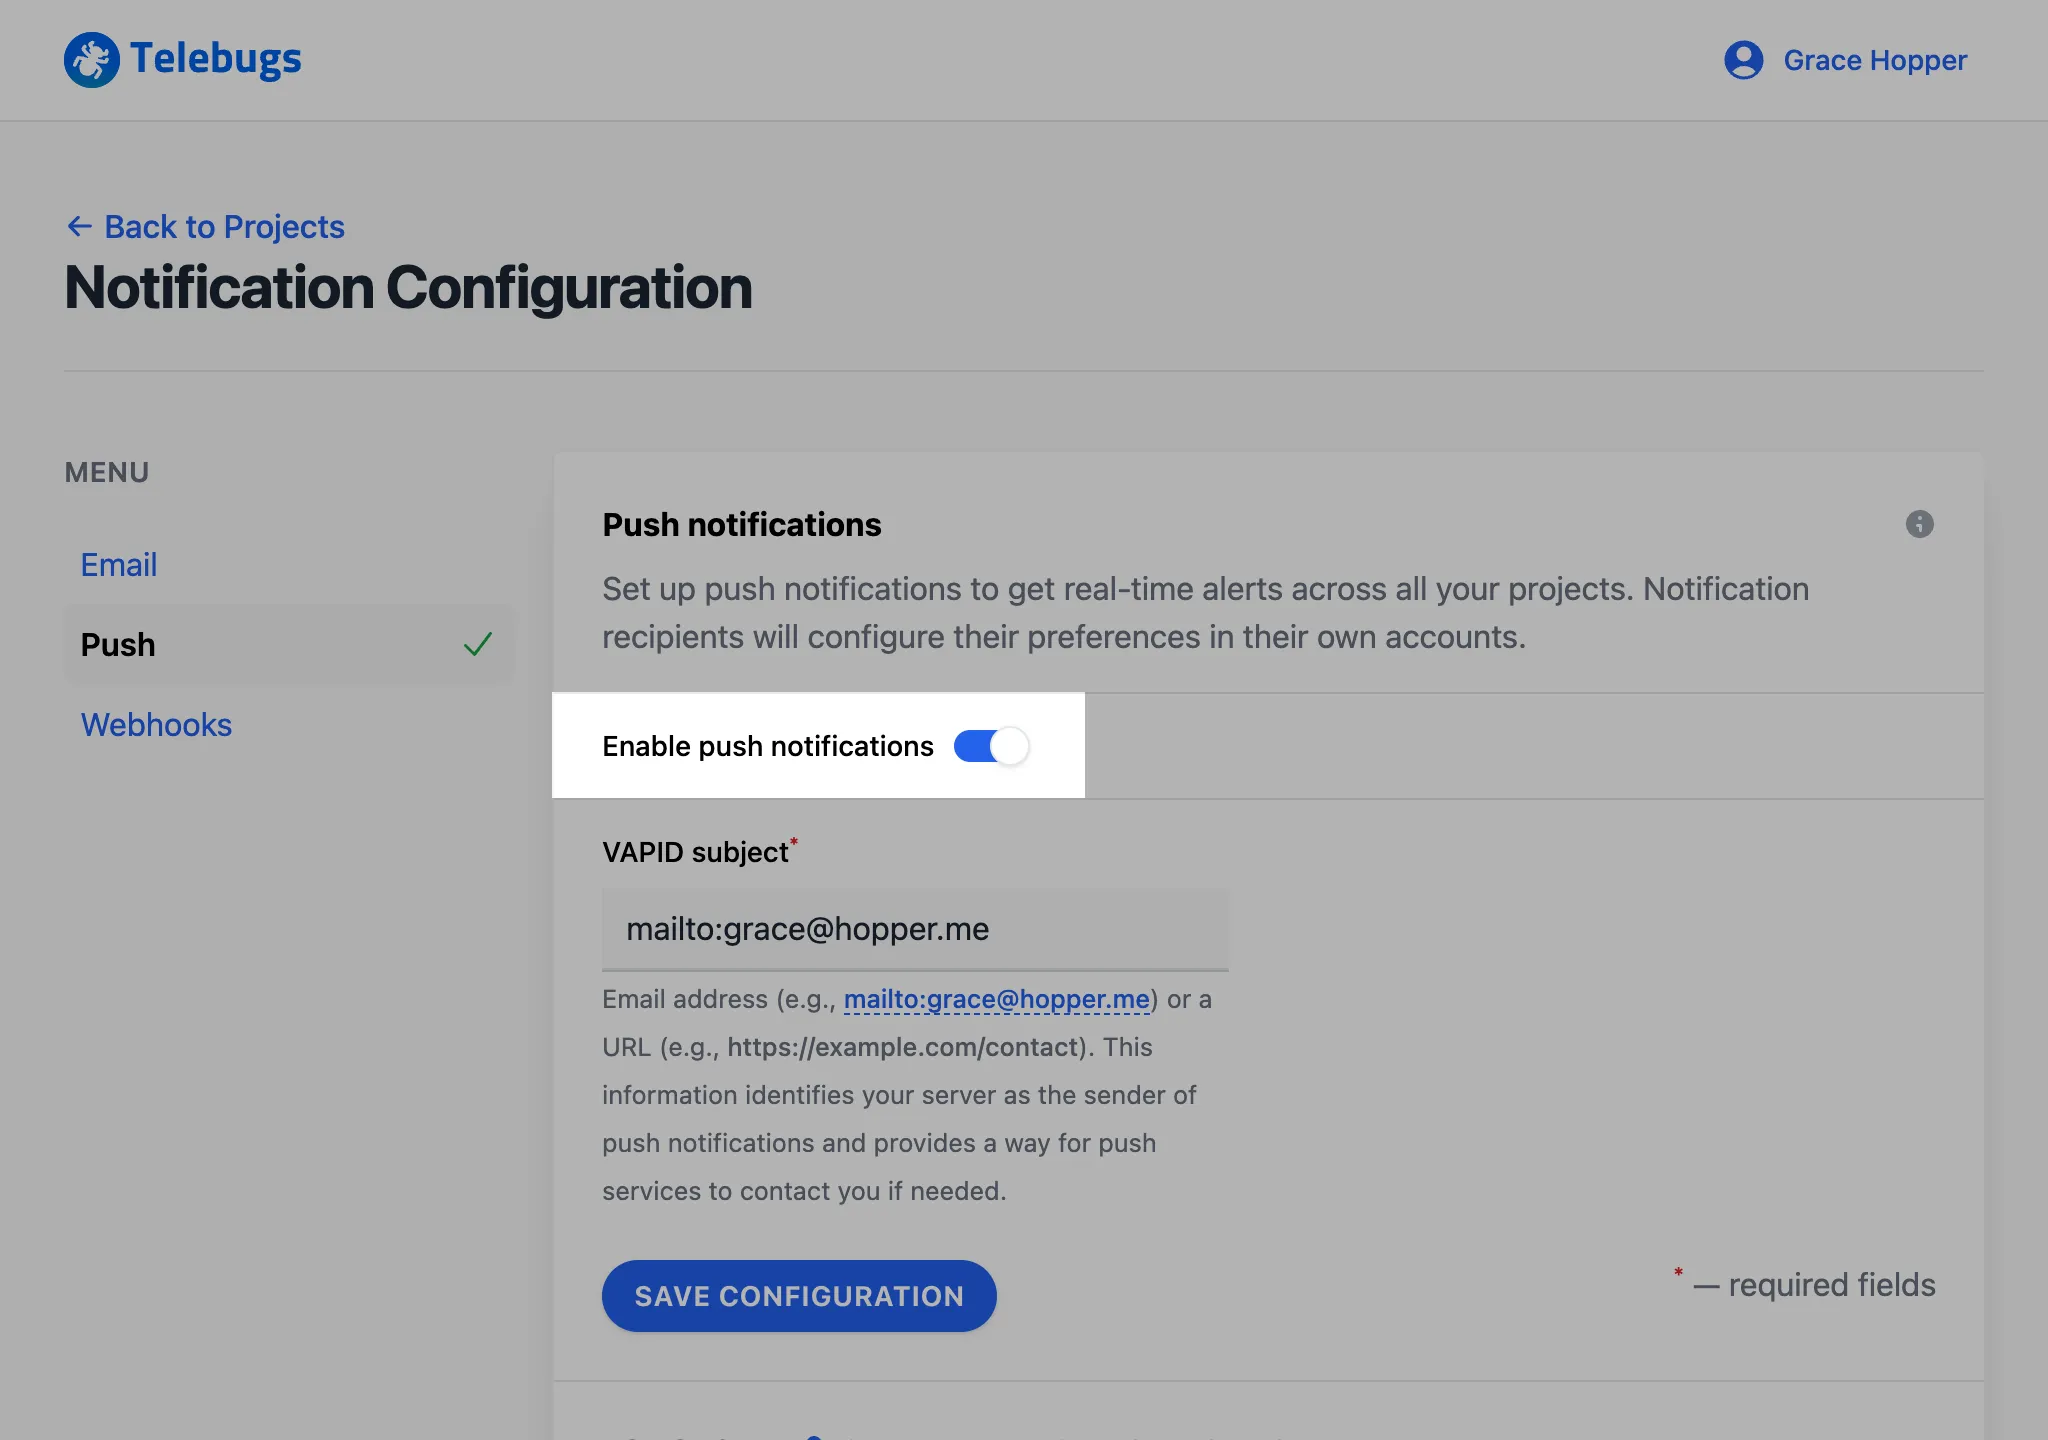
Follow these steps to configure push notifications:
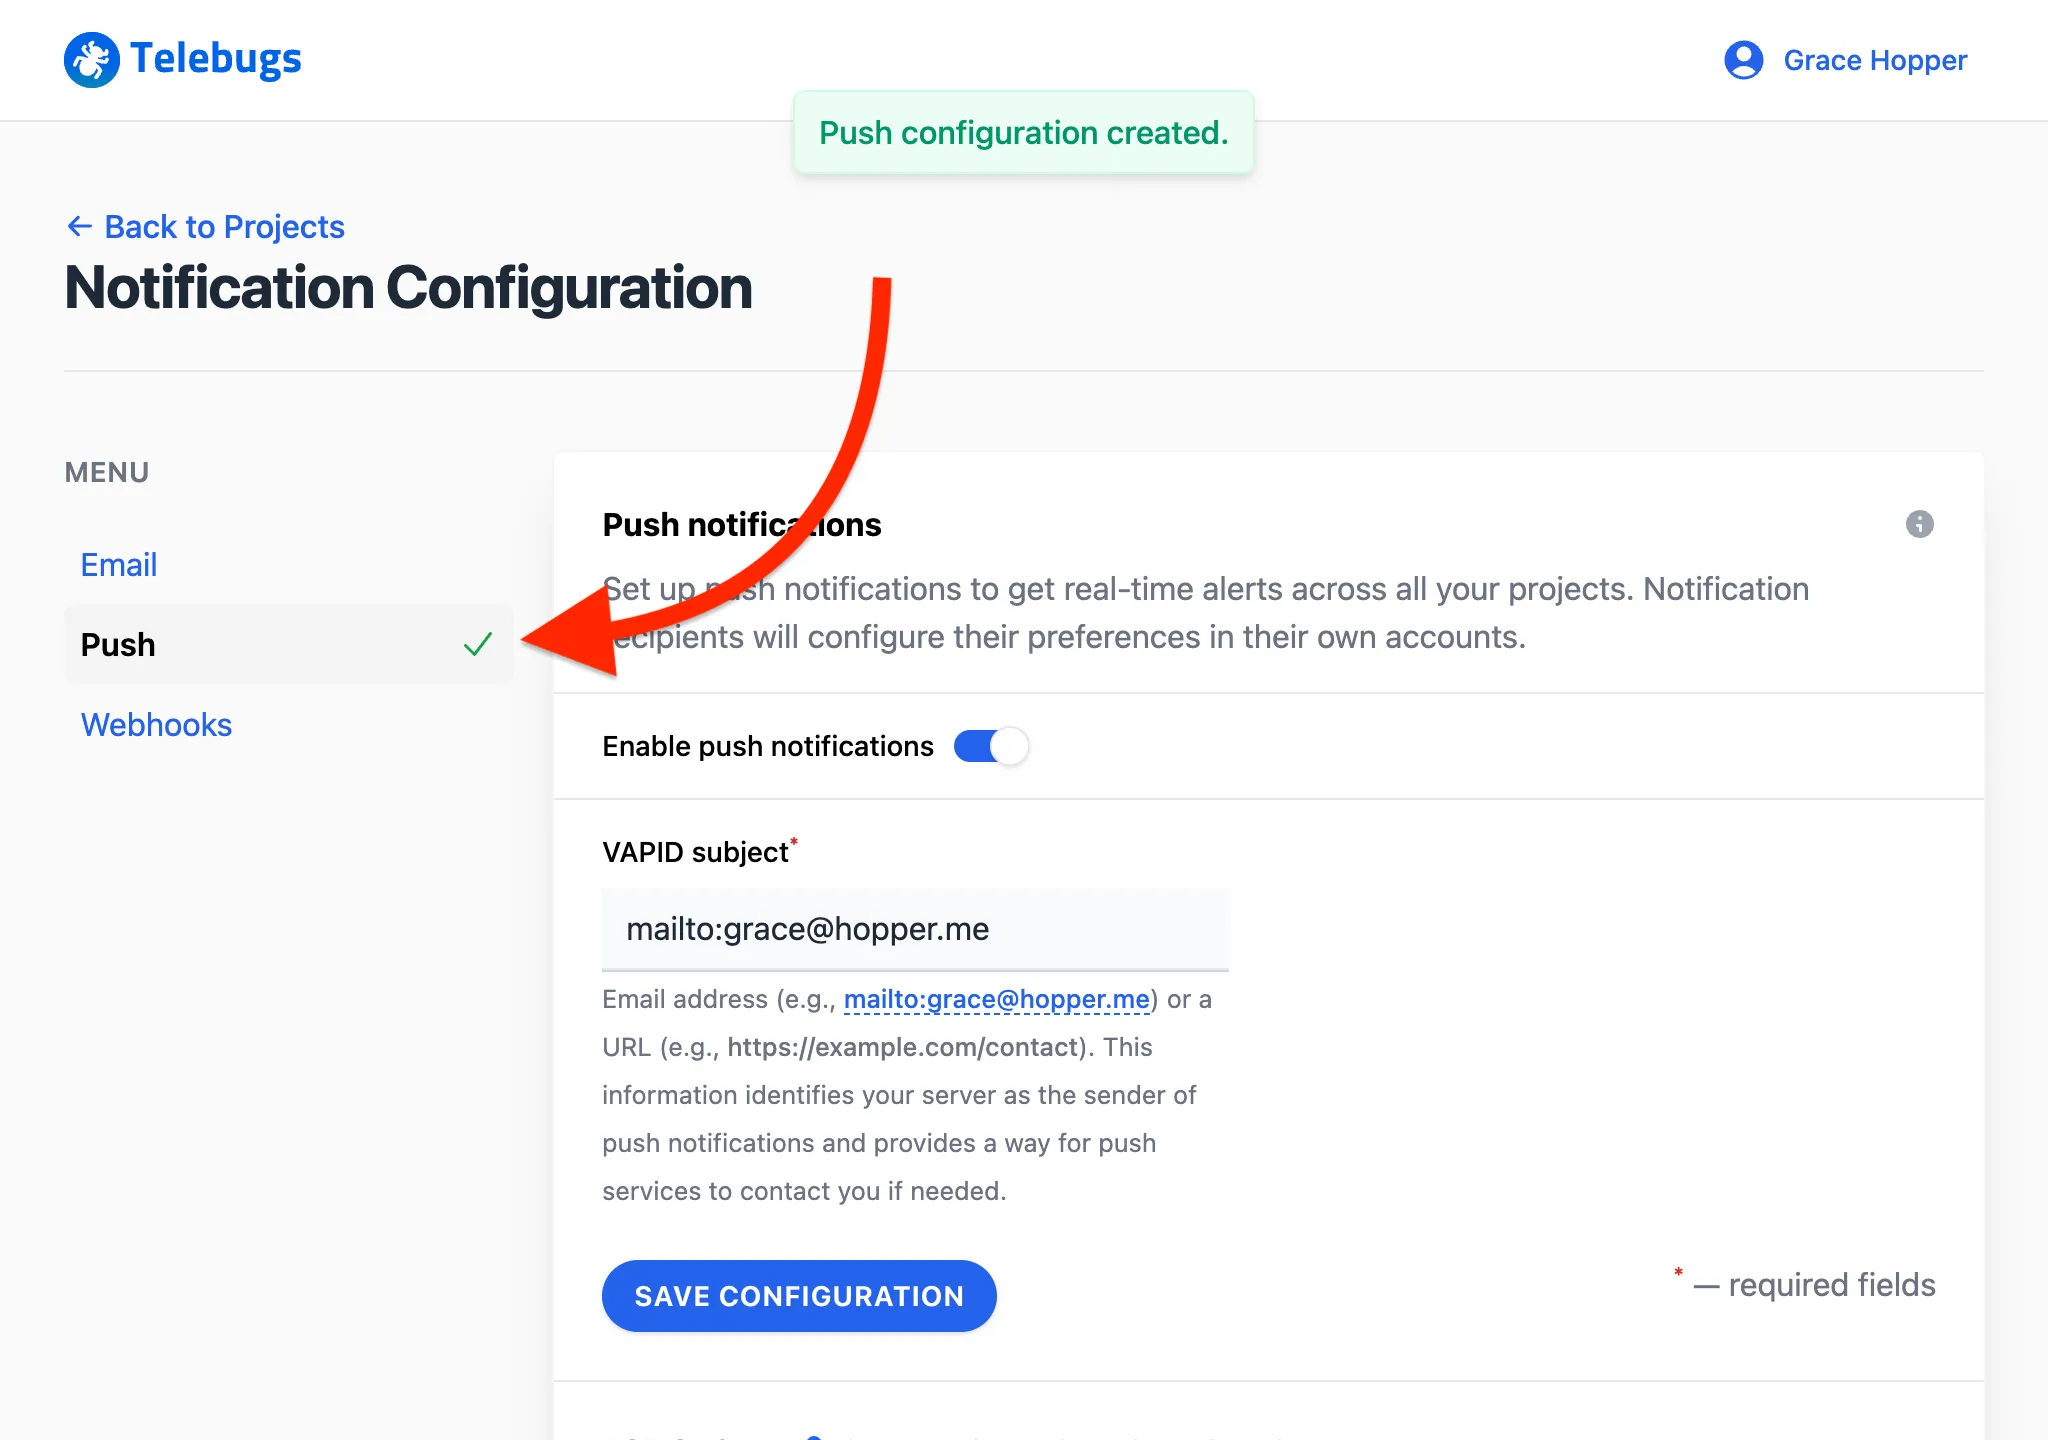
- Open the menu in the top-right corner, click your profile name, and select
Notification Configuration.

- In the sidebar on the left, select Push.

- Complete the Push notifications configuration form, then click Save Configuration to apply your settings.
- Once the form is saved, a green checkmark appears next to Push in
the sidebar, indicating that push notifications are configured.
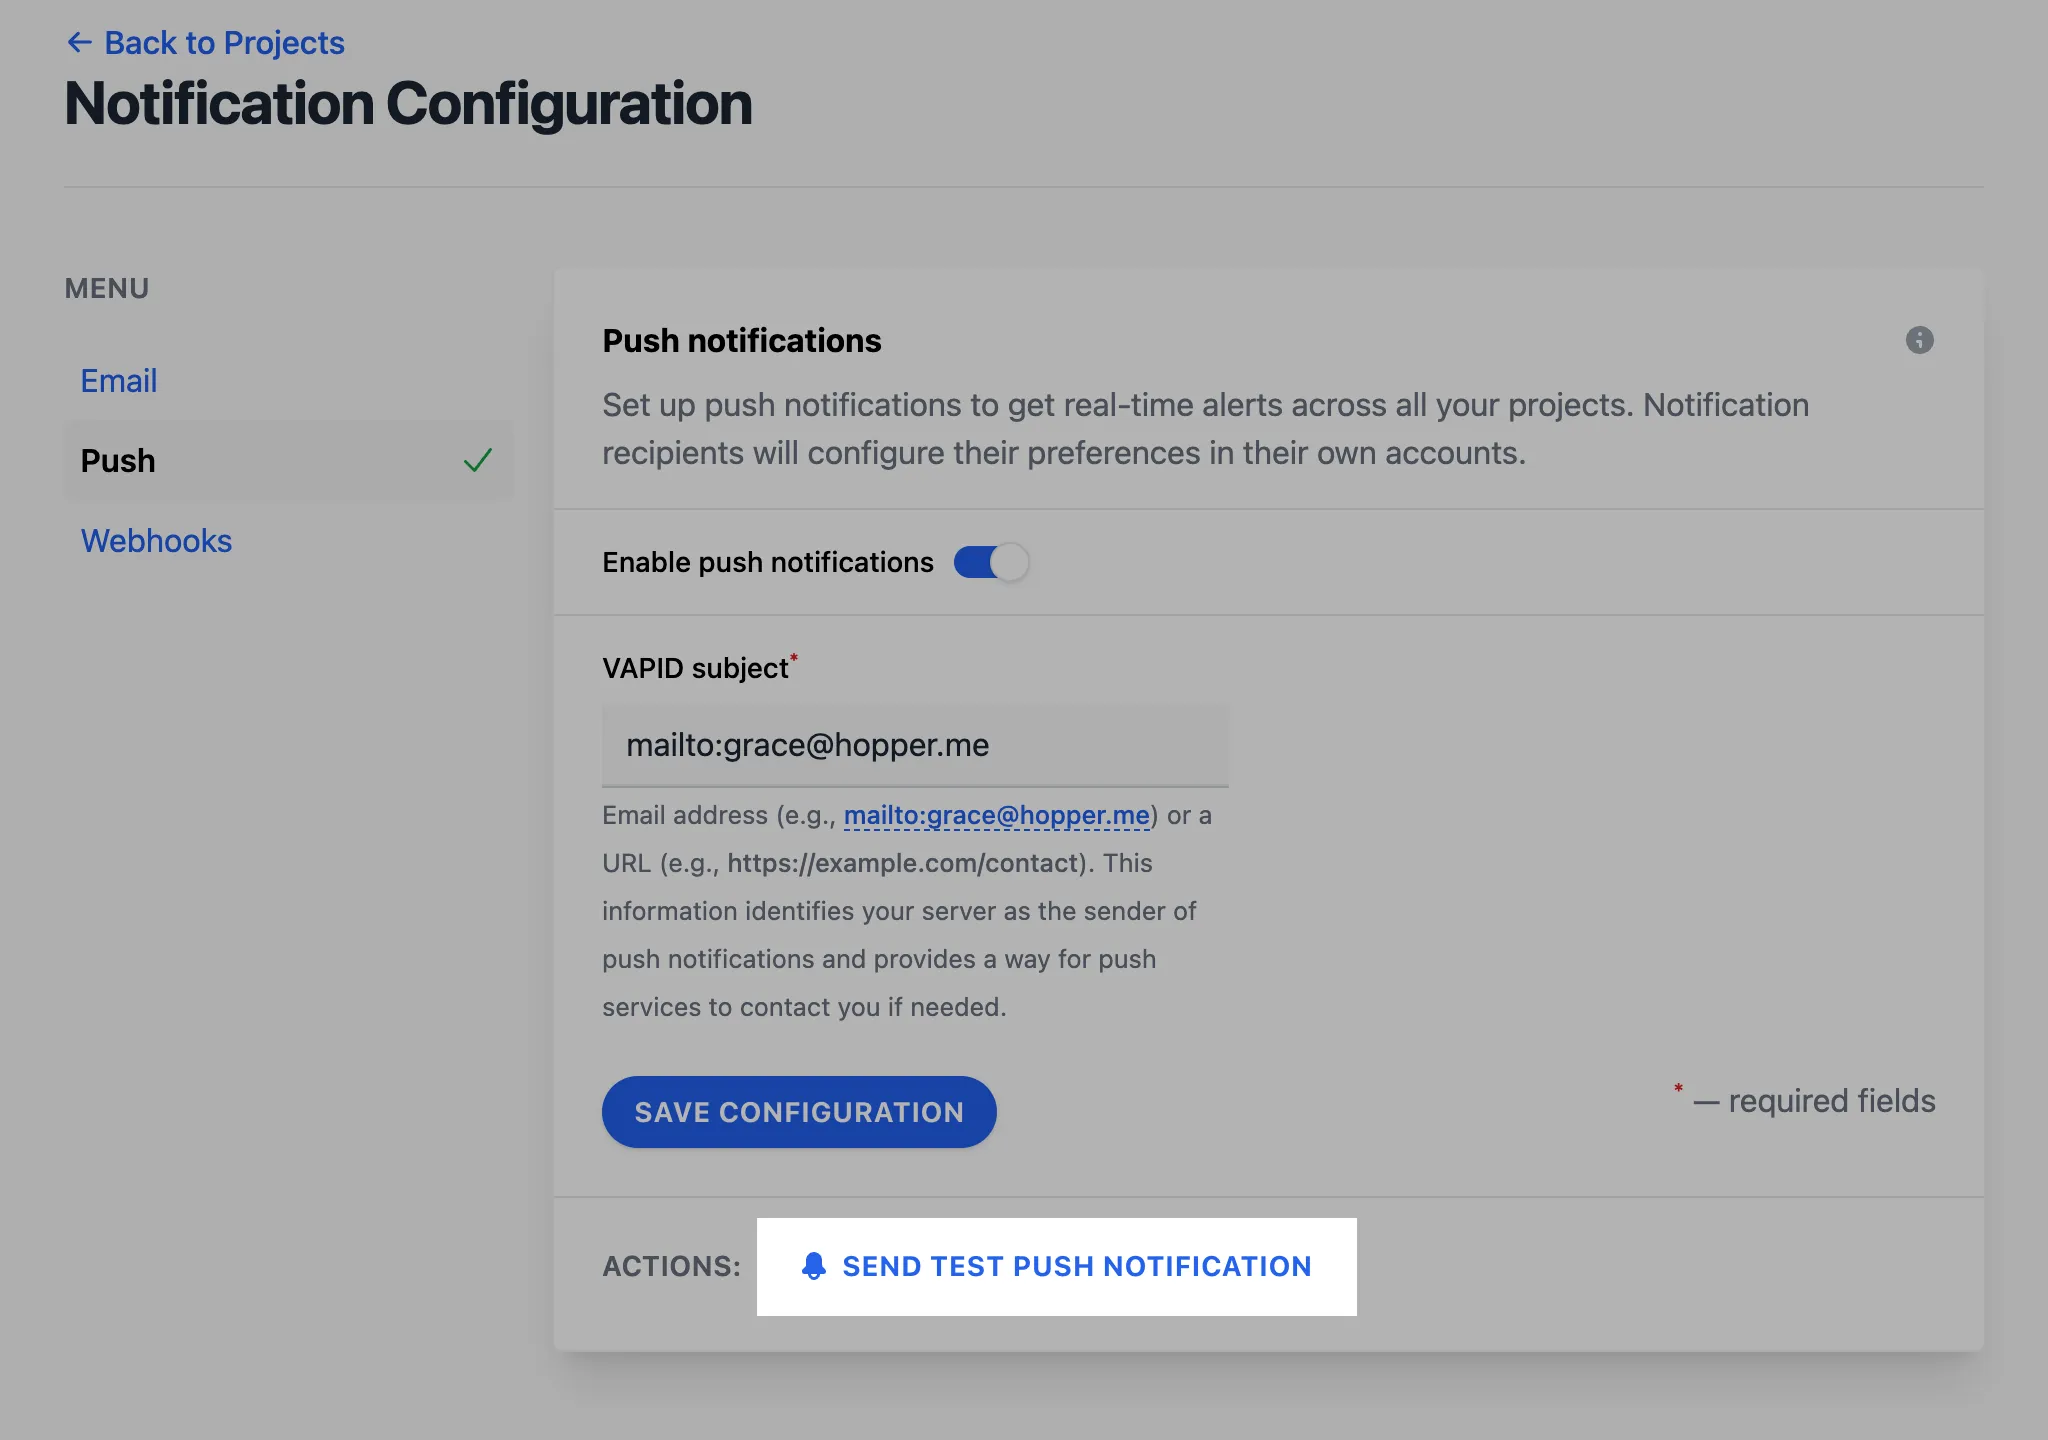
- Click the Send test push notification button to verify that
notifications work.
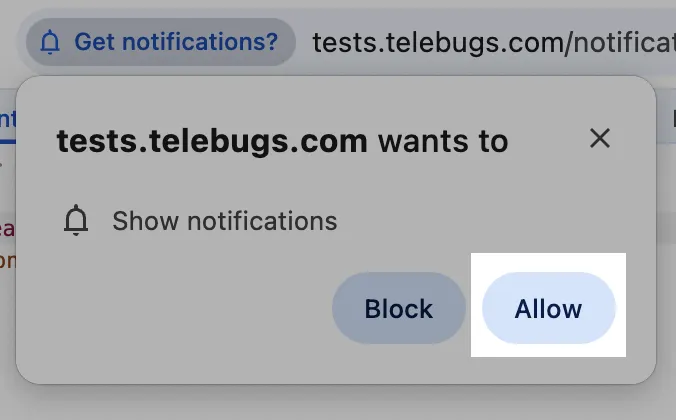
- If prompted, allow push notifications in your browser or device.
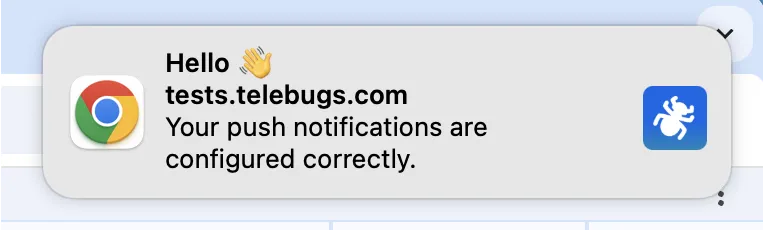
- A confirmation toast appears, showing that the test push notification has been sent.
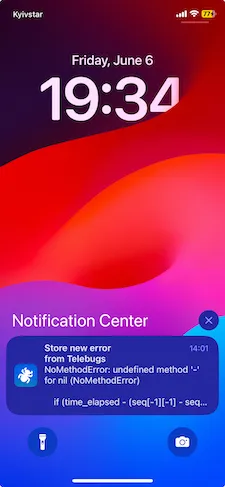
- Check your device; you should receive a test push notification.
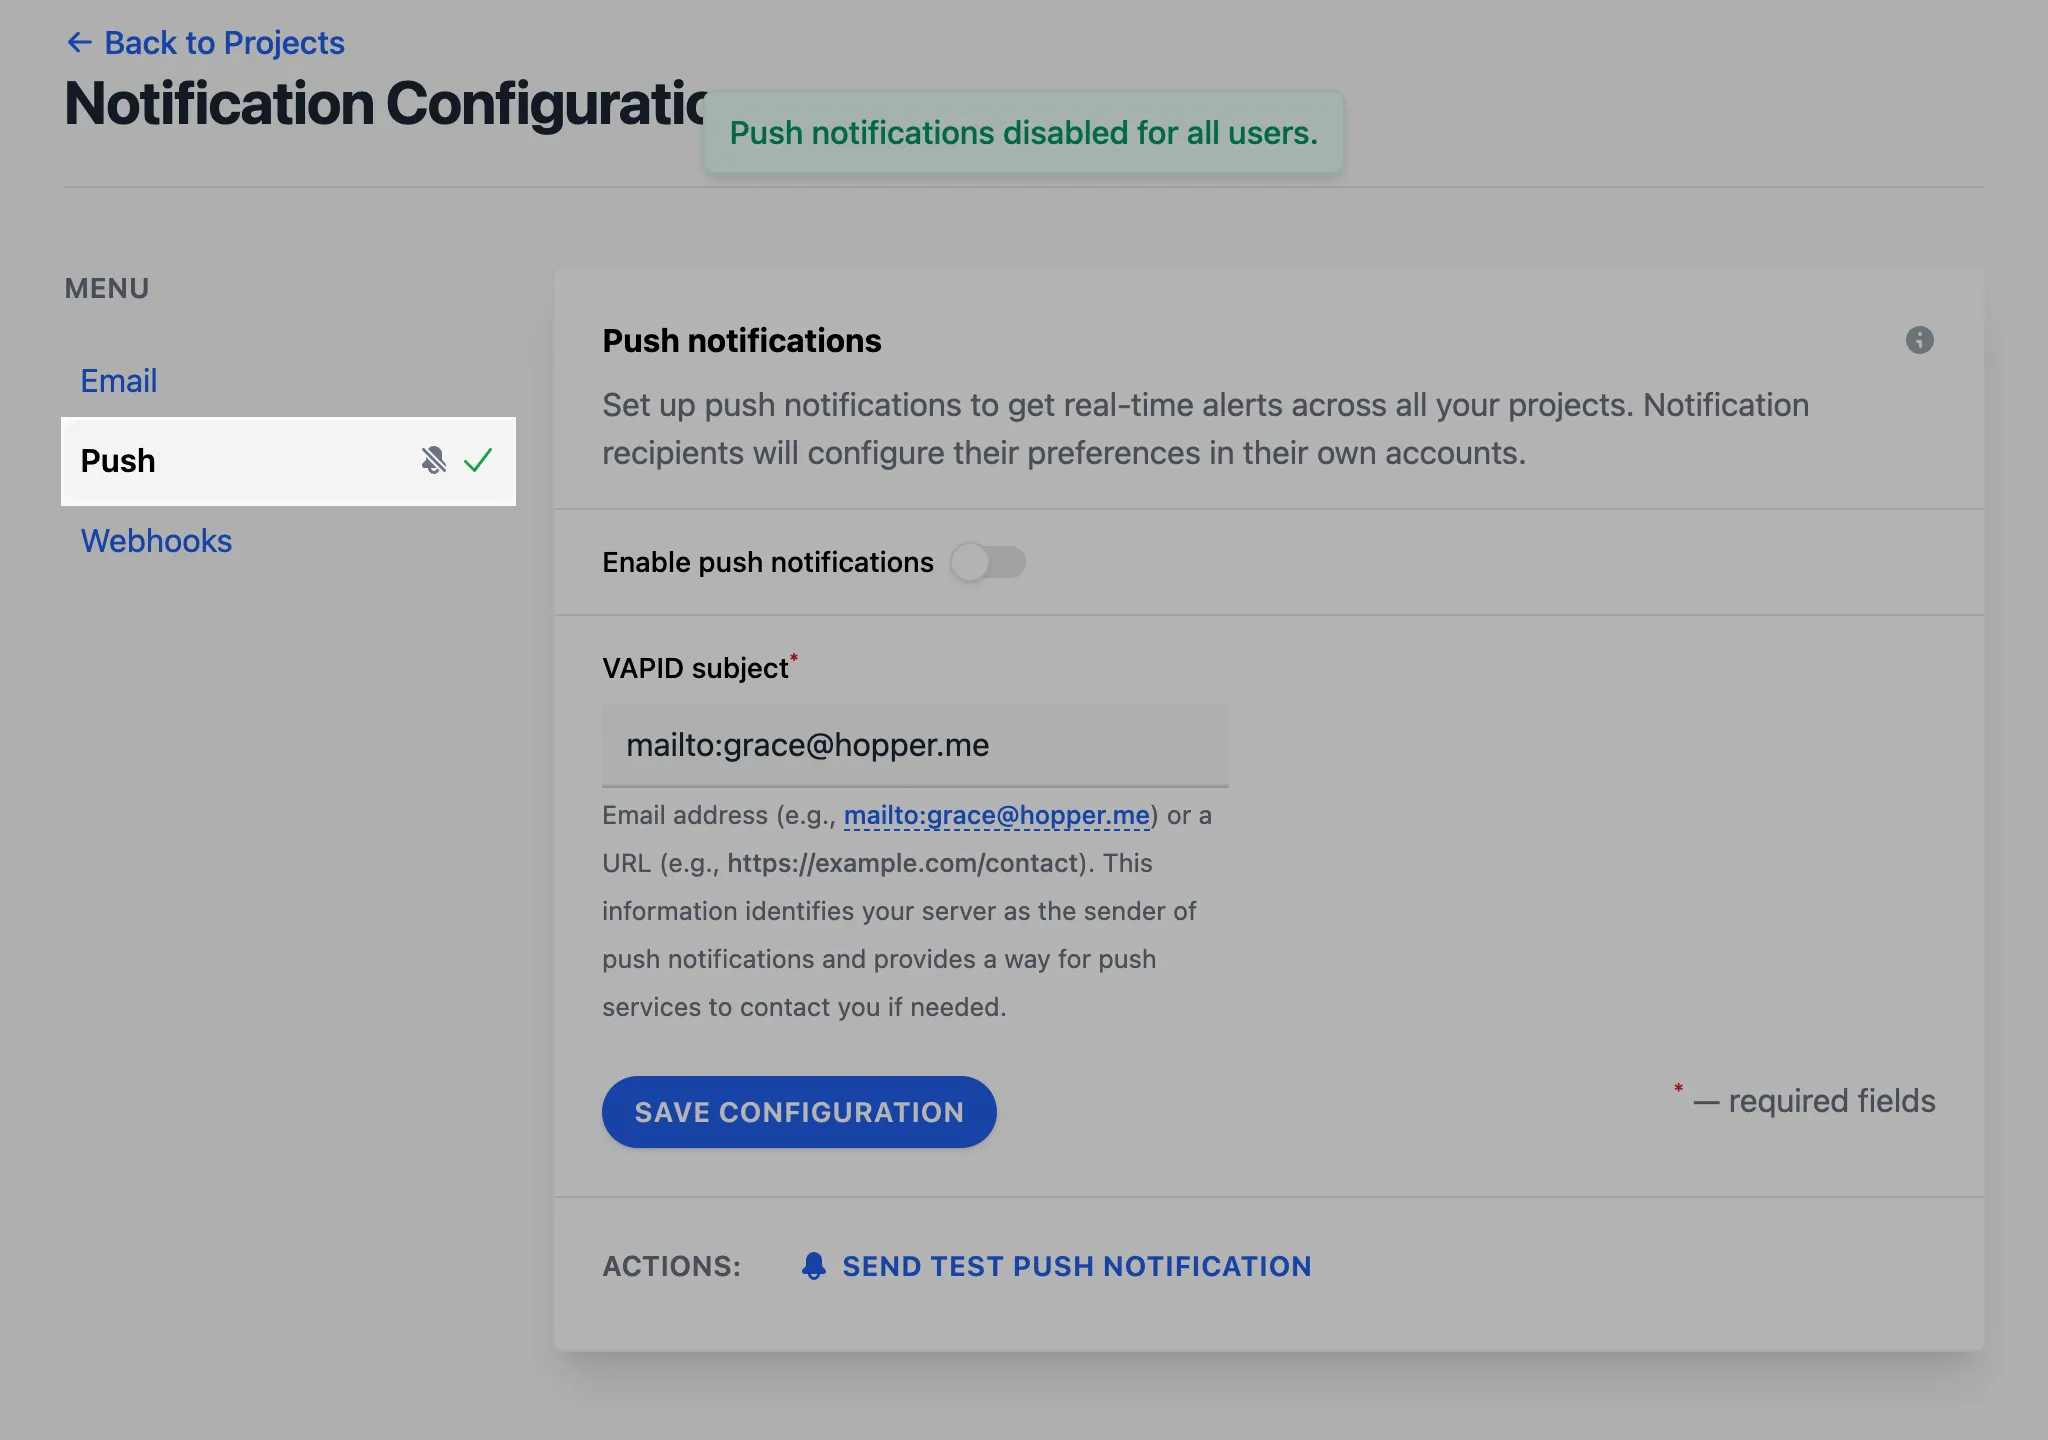
- To disable all push notifications, toggle off Enable push
notifications.
The sidebar icon will change to a bell with a slash, indicating that push
notifications are disabled.
- When a real error occurs, you will receive a push notification according
to the rules you configured in project settings. The notification includes
details such as the error message, a link to the error report in Telebugs, and
the project name.
Push notifications configuration form 
The Push notifications configuration form defines global settings that all projects inherit. Complete the fields as follows:
- VAPID subject: Enter the
VAPID subject,
which is used to identify the application server sending push notifications.
This is typically a URL or an email address associated with your Telebugs
instance (for example,
https://telebugs.example.comormailto:[email protected]). This field is required.
Once you save these settings, Telebugs will send push notifications according to the project-level rules you configured earlier.
10.2.1 Installing Telebugs as a Progressive Web App (PWA) 
Telebugs can be installed as a Progressive Web App (PWA) on your mobile device. A PWA is a web application that provides a native app-like experience, including the ability to receive push notifications more reliably. Installing Telebugs as a PWA is optional but recommended for users who want to receive push notifications on their mobile devices.
Benefits of installing Telebugs as a PWA 
- Improved performance and faster load times.
- Ability to receive push notifications even when the browser is not actively open.
- A more seamless, app-like experience on your mobile device.
Installation Instructions 
For Android devices:
You can install the Telebugs PWA on Android using one of the following methods:
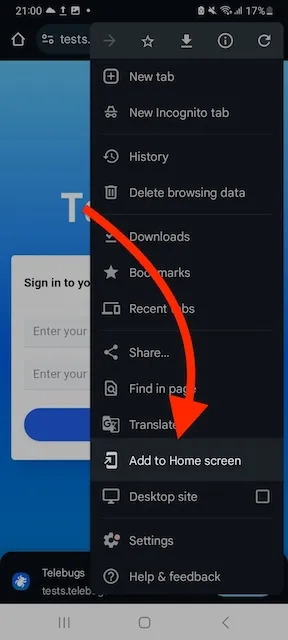
Method 1: Using the browser menu 
- Open the Telebugs web app in the Chrome browser.
- Tap the menu button (three dots) in the top-right corner of the browser.
- Select "Add to Home screen" from the menu.
- Confirm the installation by tapping "Add" or "Install."
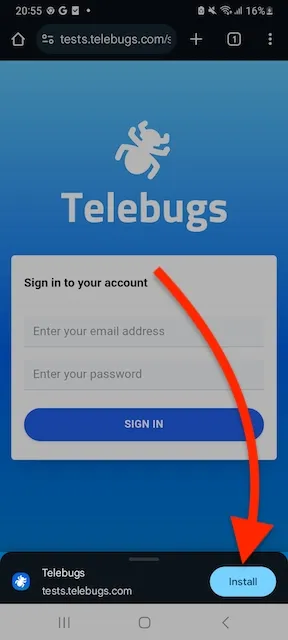
Method 2: Using the automatic install prompt 
When you visit the Telebugs web app in Chrome on Android, you may see an "Install" button at the bottom of the screen. This is an automatic prompt from the browser to install the PWA.
- Open the Telebugs web app in the Chrome browser.
- If the "Install" button appears at the bottom of the screen, tap it.
- Confirm the installation by tapping "Install" in the dialog that appears.
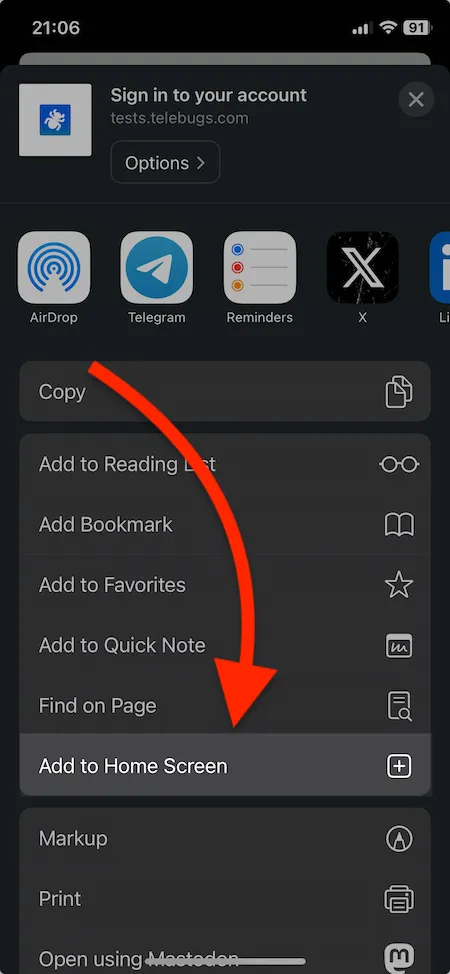
For iOS devices:
- Open the Telebugs web app in the Safari browser.
- Tap the share button (a square with an arrow pointing upwards) at the bottom of the screen.
- Scroll down the share menu and select "Add to Home Screen".
- Confirm the installation by tapping "Add".
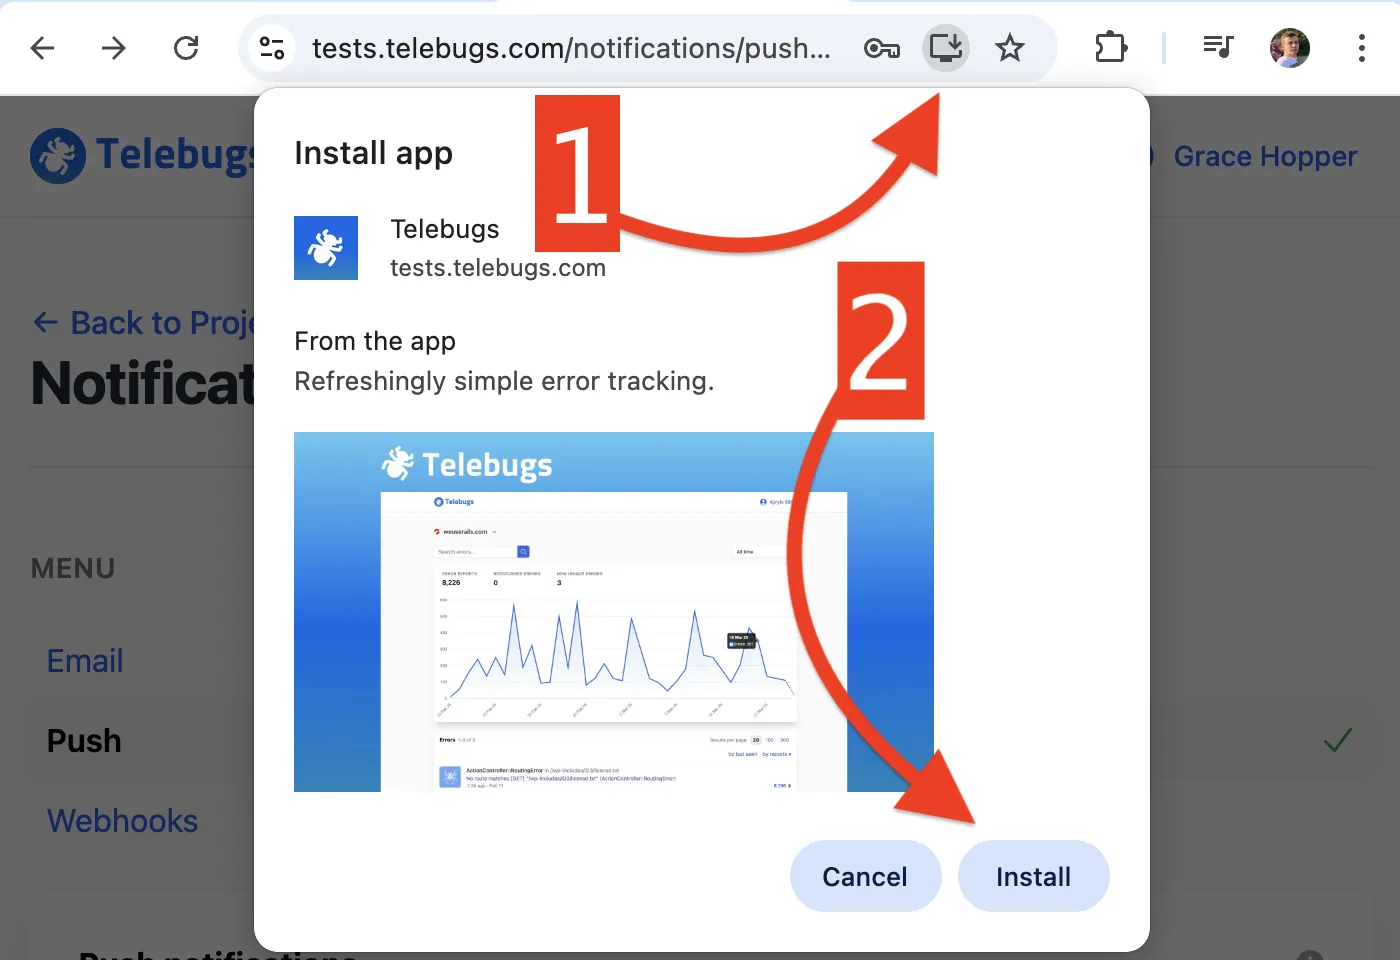
Optional: Installing on Desktop (Chrome) 
If you prefer to have Telebugs as a standalone application on your desktop, you can install it as a PWA using Chrome. This is not required for receiving push notifications on desktop, as they work directly in the browser once notifications are allowed.
- Open Telebugs in Chrome on your desktop.
- Click the plus icon (+) in the address bar or go to the Chrome menu (three dots) and select "Install Telebugs."
- Confirm the installation by clicking "Install."
Note: The exact steps may vary slightly depending on your device and browser version. If you encounter issues during installation, ensure that your browser is up to date and that you have granted the necessary permissions for notifications.
10.3 Webhooks 
Webhooks in Telebugs enable real-time notifications to be sent to external services whenever specific events occur, such as a new error being reported, an error reoccurring, or the error frequency exceeding a set threshold. This feature allows integration with tools like Slack, Discord, or any custom endpoint that accepts HTTP POST requests. Once webhooks are configured globally, individual projects can opt to use them or disable them via project settings. After setup, project-level rules dictate when notifications are sent to the configured webhook URLs.
You can configure webhooks to trigger under these conditions:
- Notify when a new error occurs for the first time.
- Notify when an error reoccurs after being resolved.
- Notify when error frequency exceeds a threshold (for example, more than 10 reports in 5 minutes).
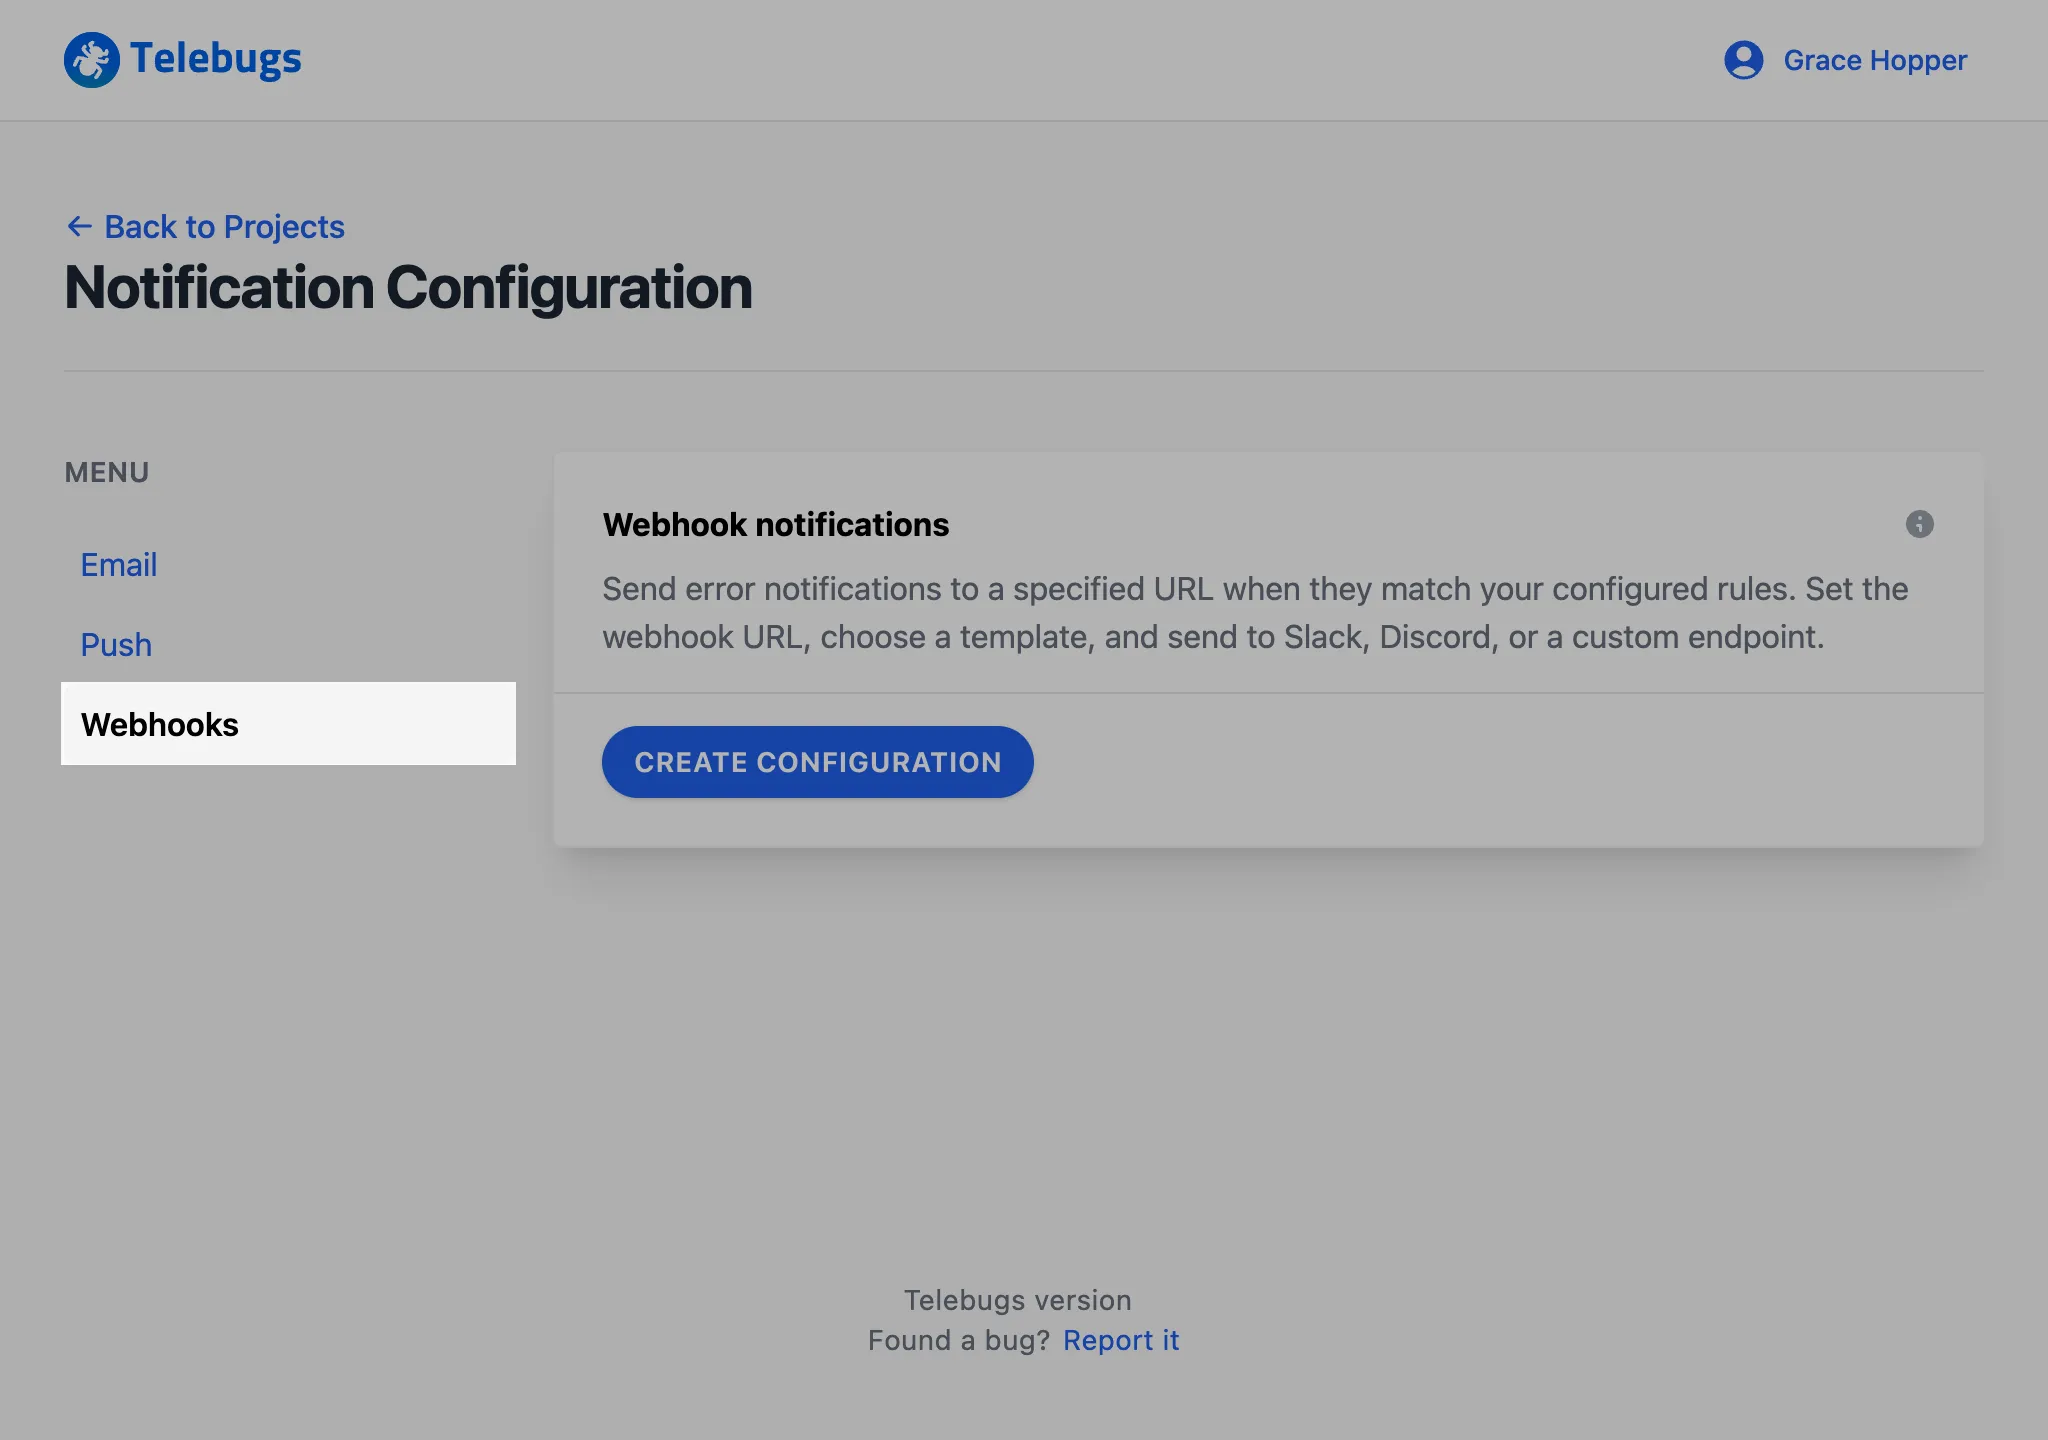
Follow these steps to configure webhook notifications:
- Open the menu in the top-right corner, click your profile name, and select
Notification Configuration.
- In the sidebar on the left, select Webhooks.
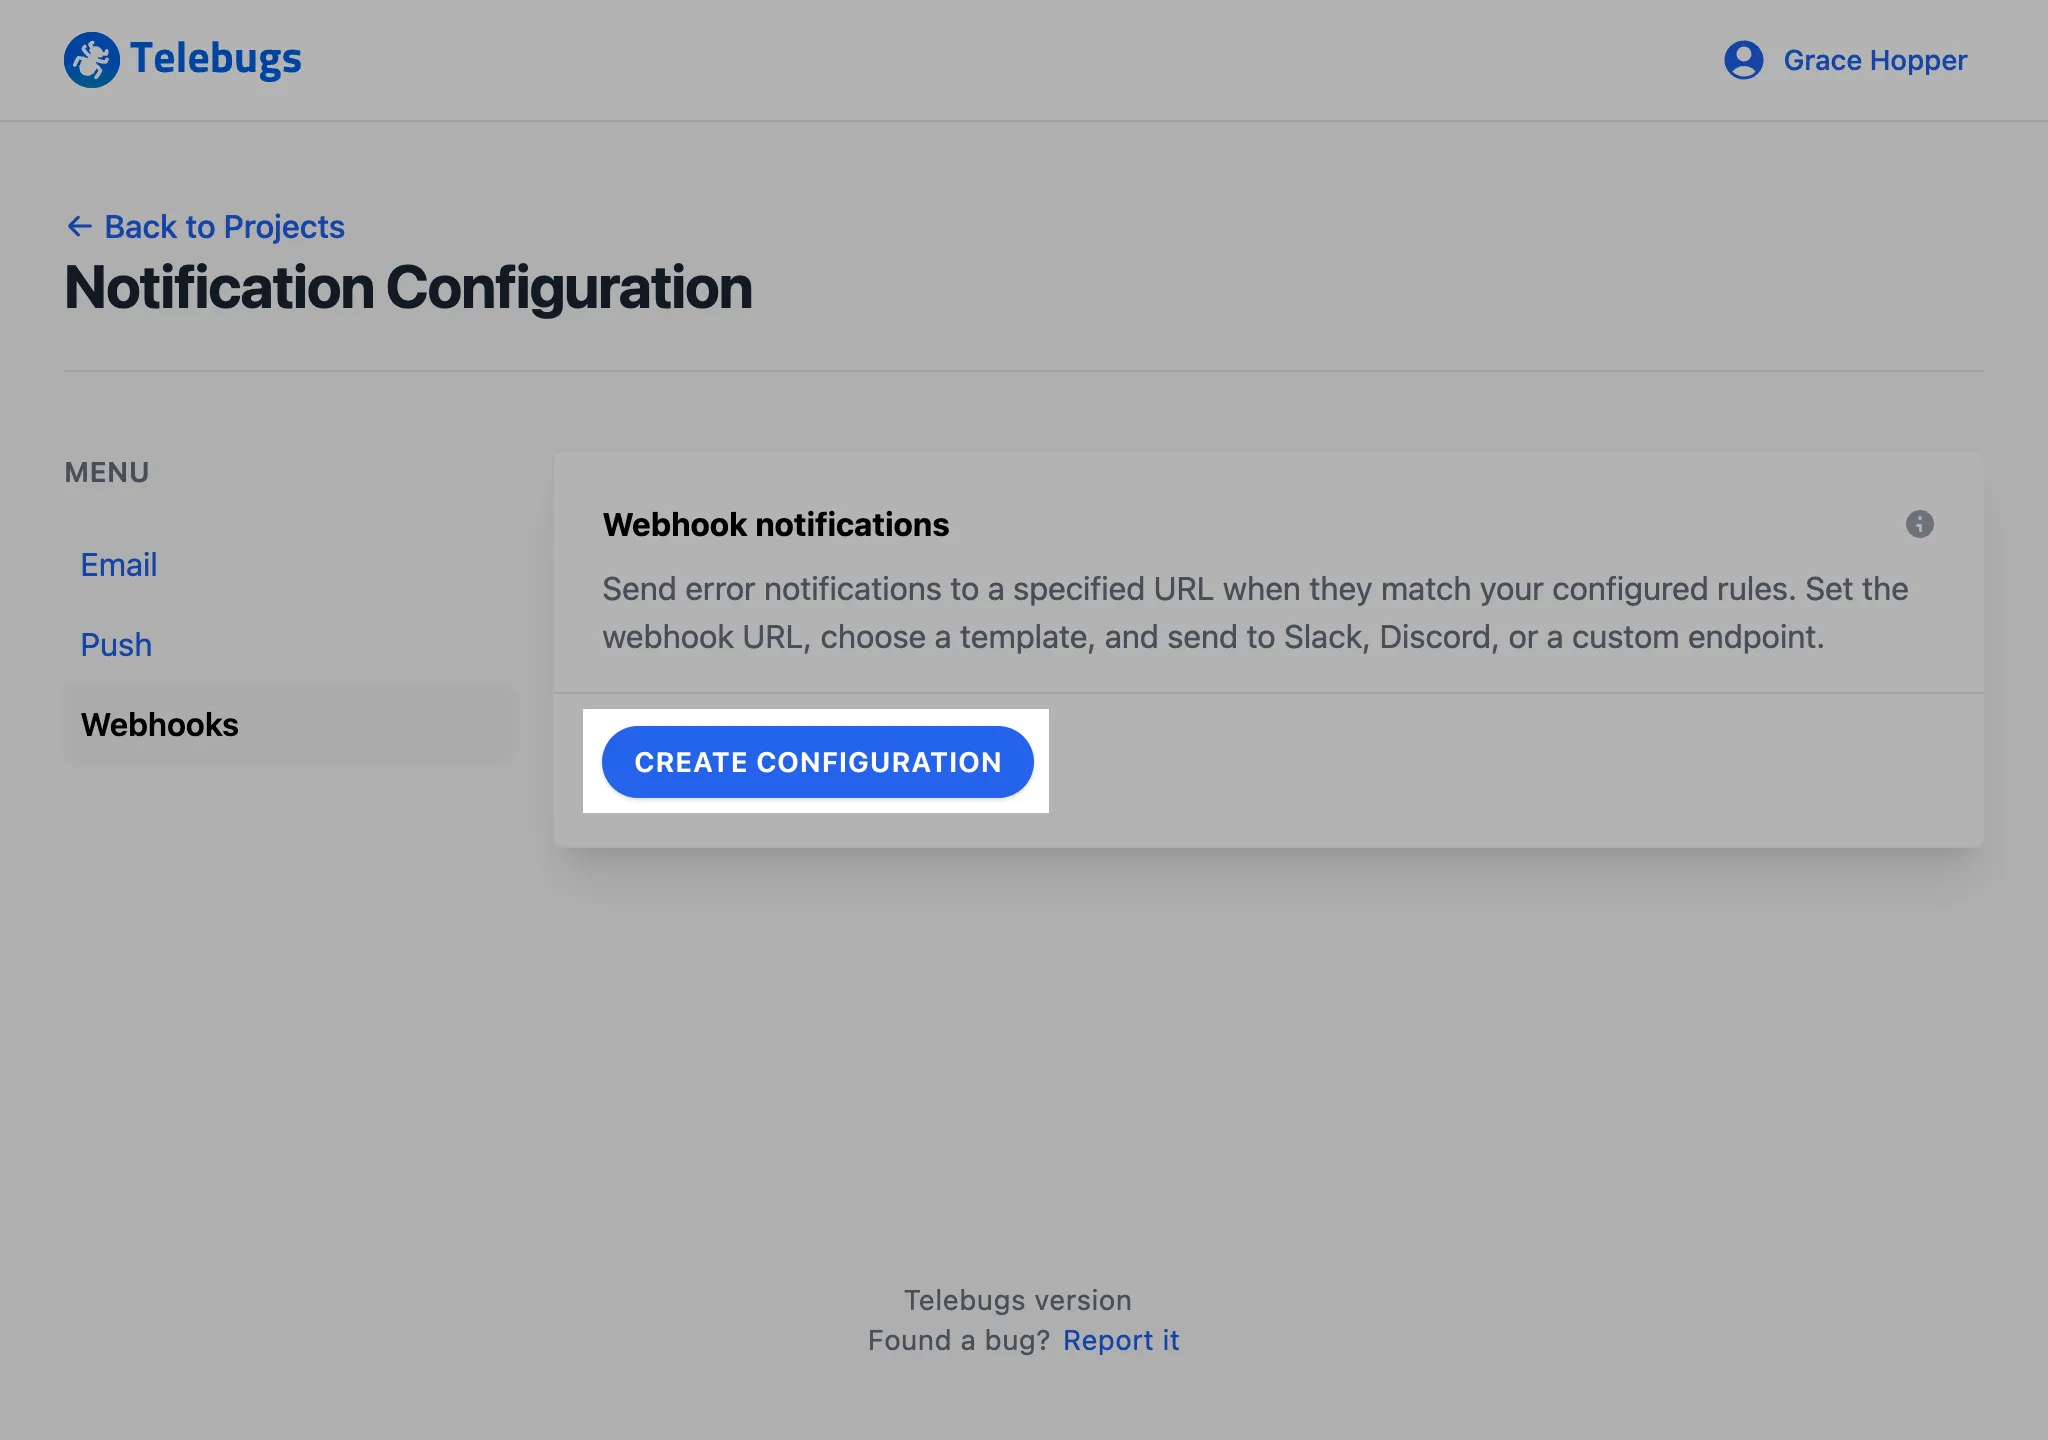
- Click the Create Configuration button to begin adding a new
webhook.
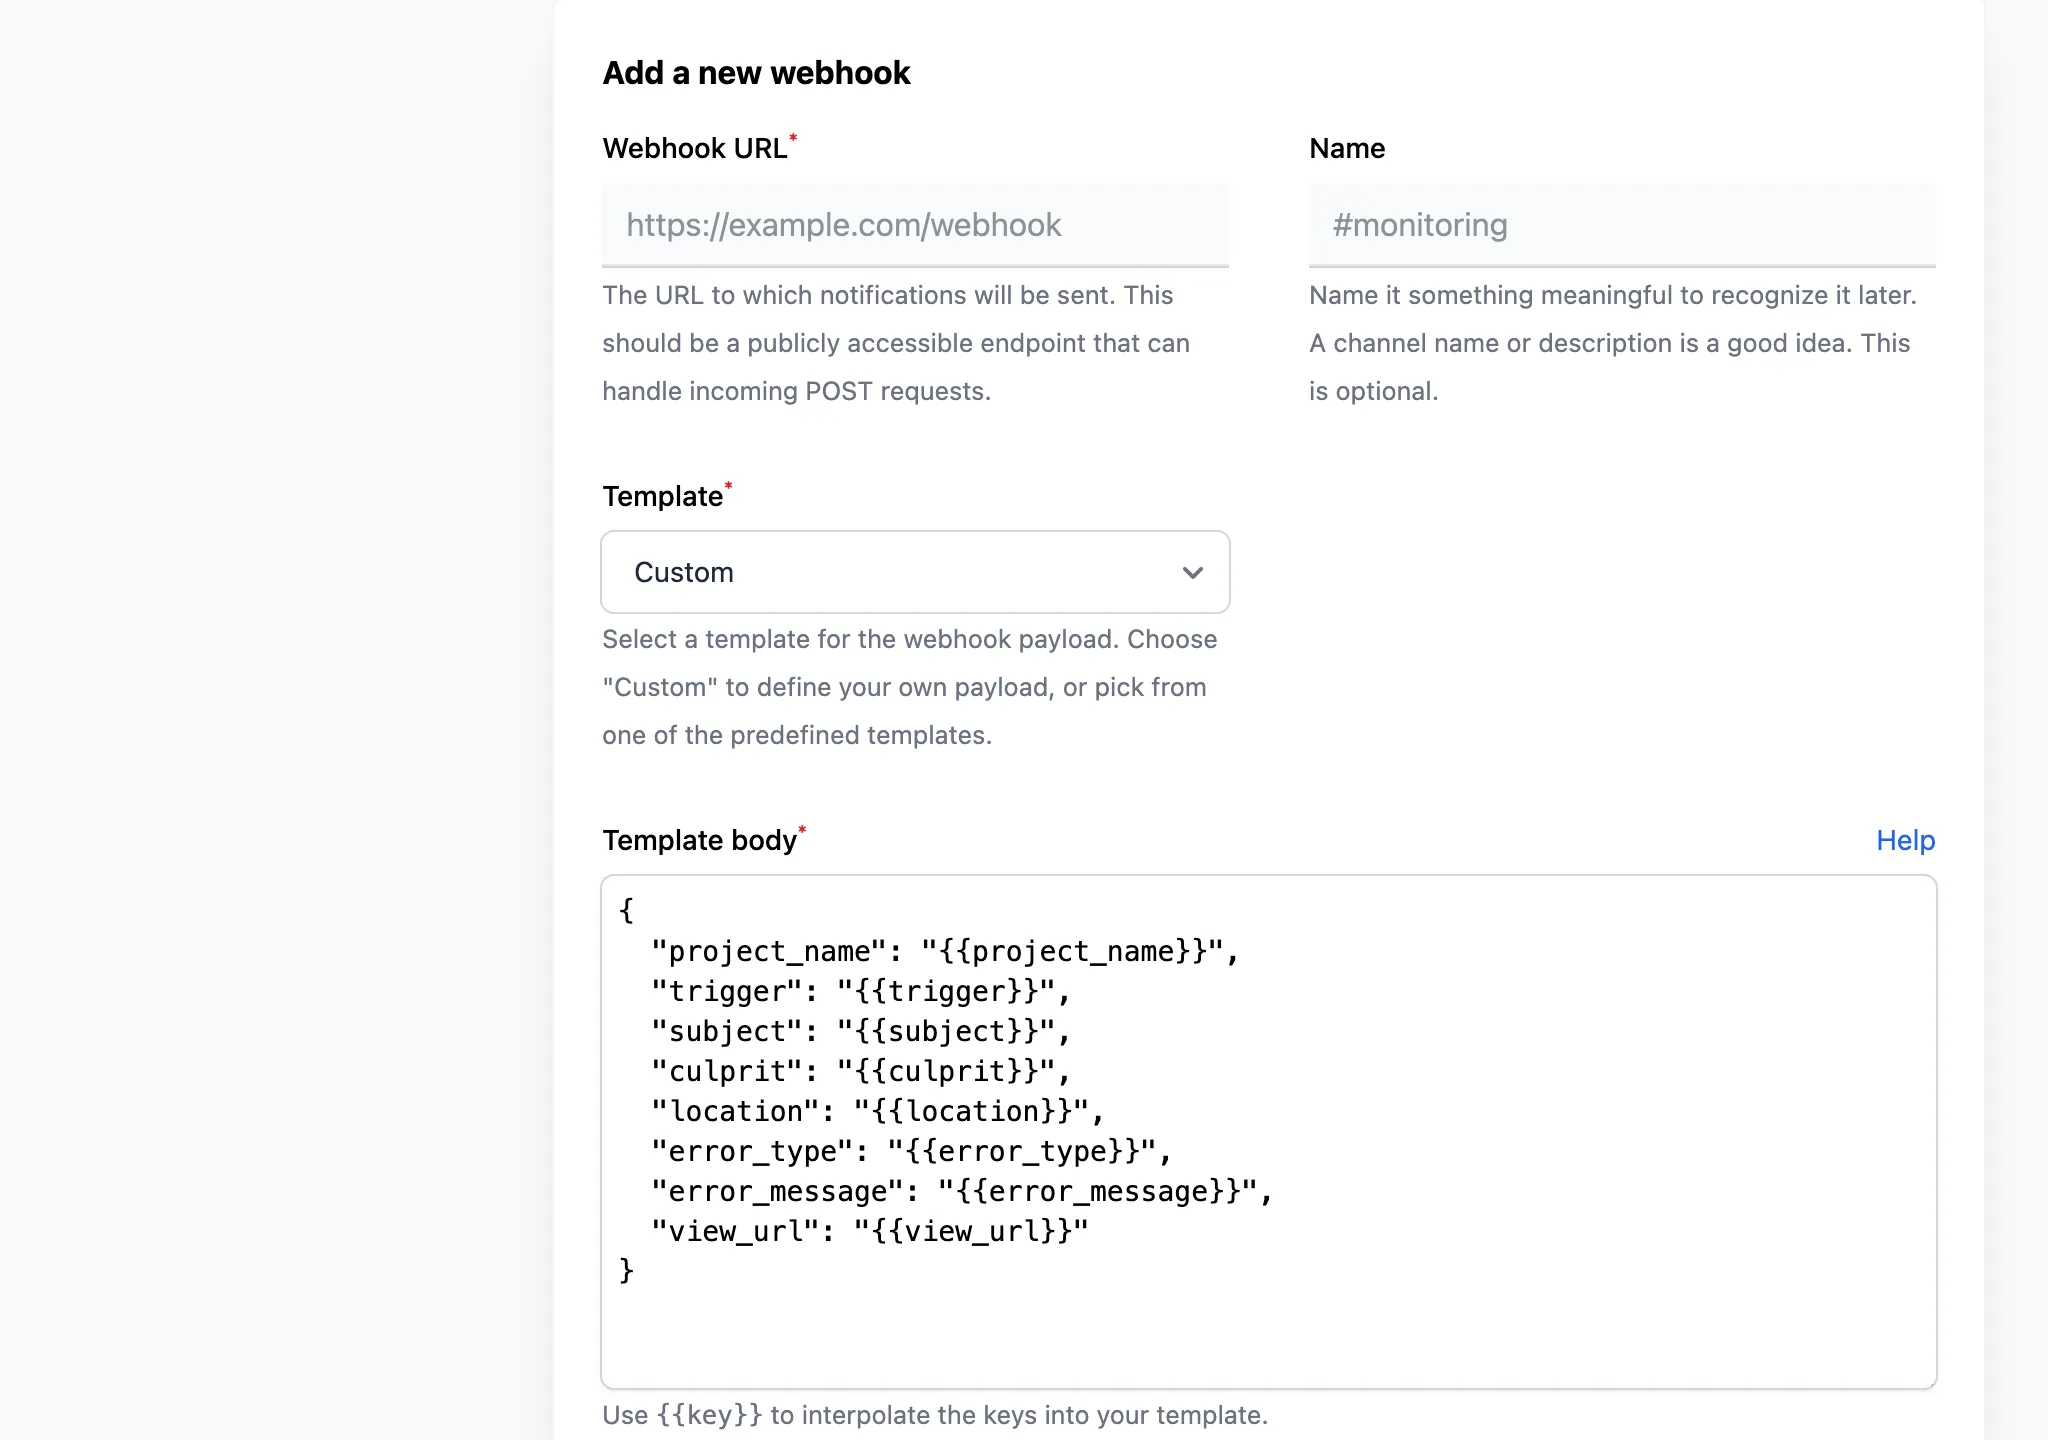
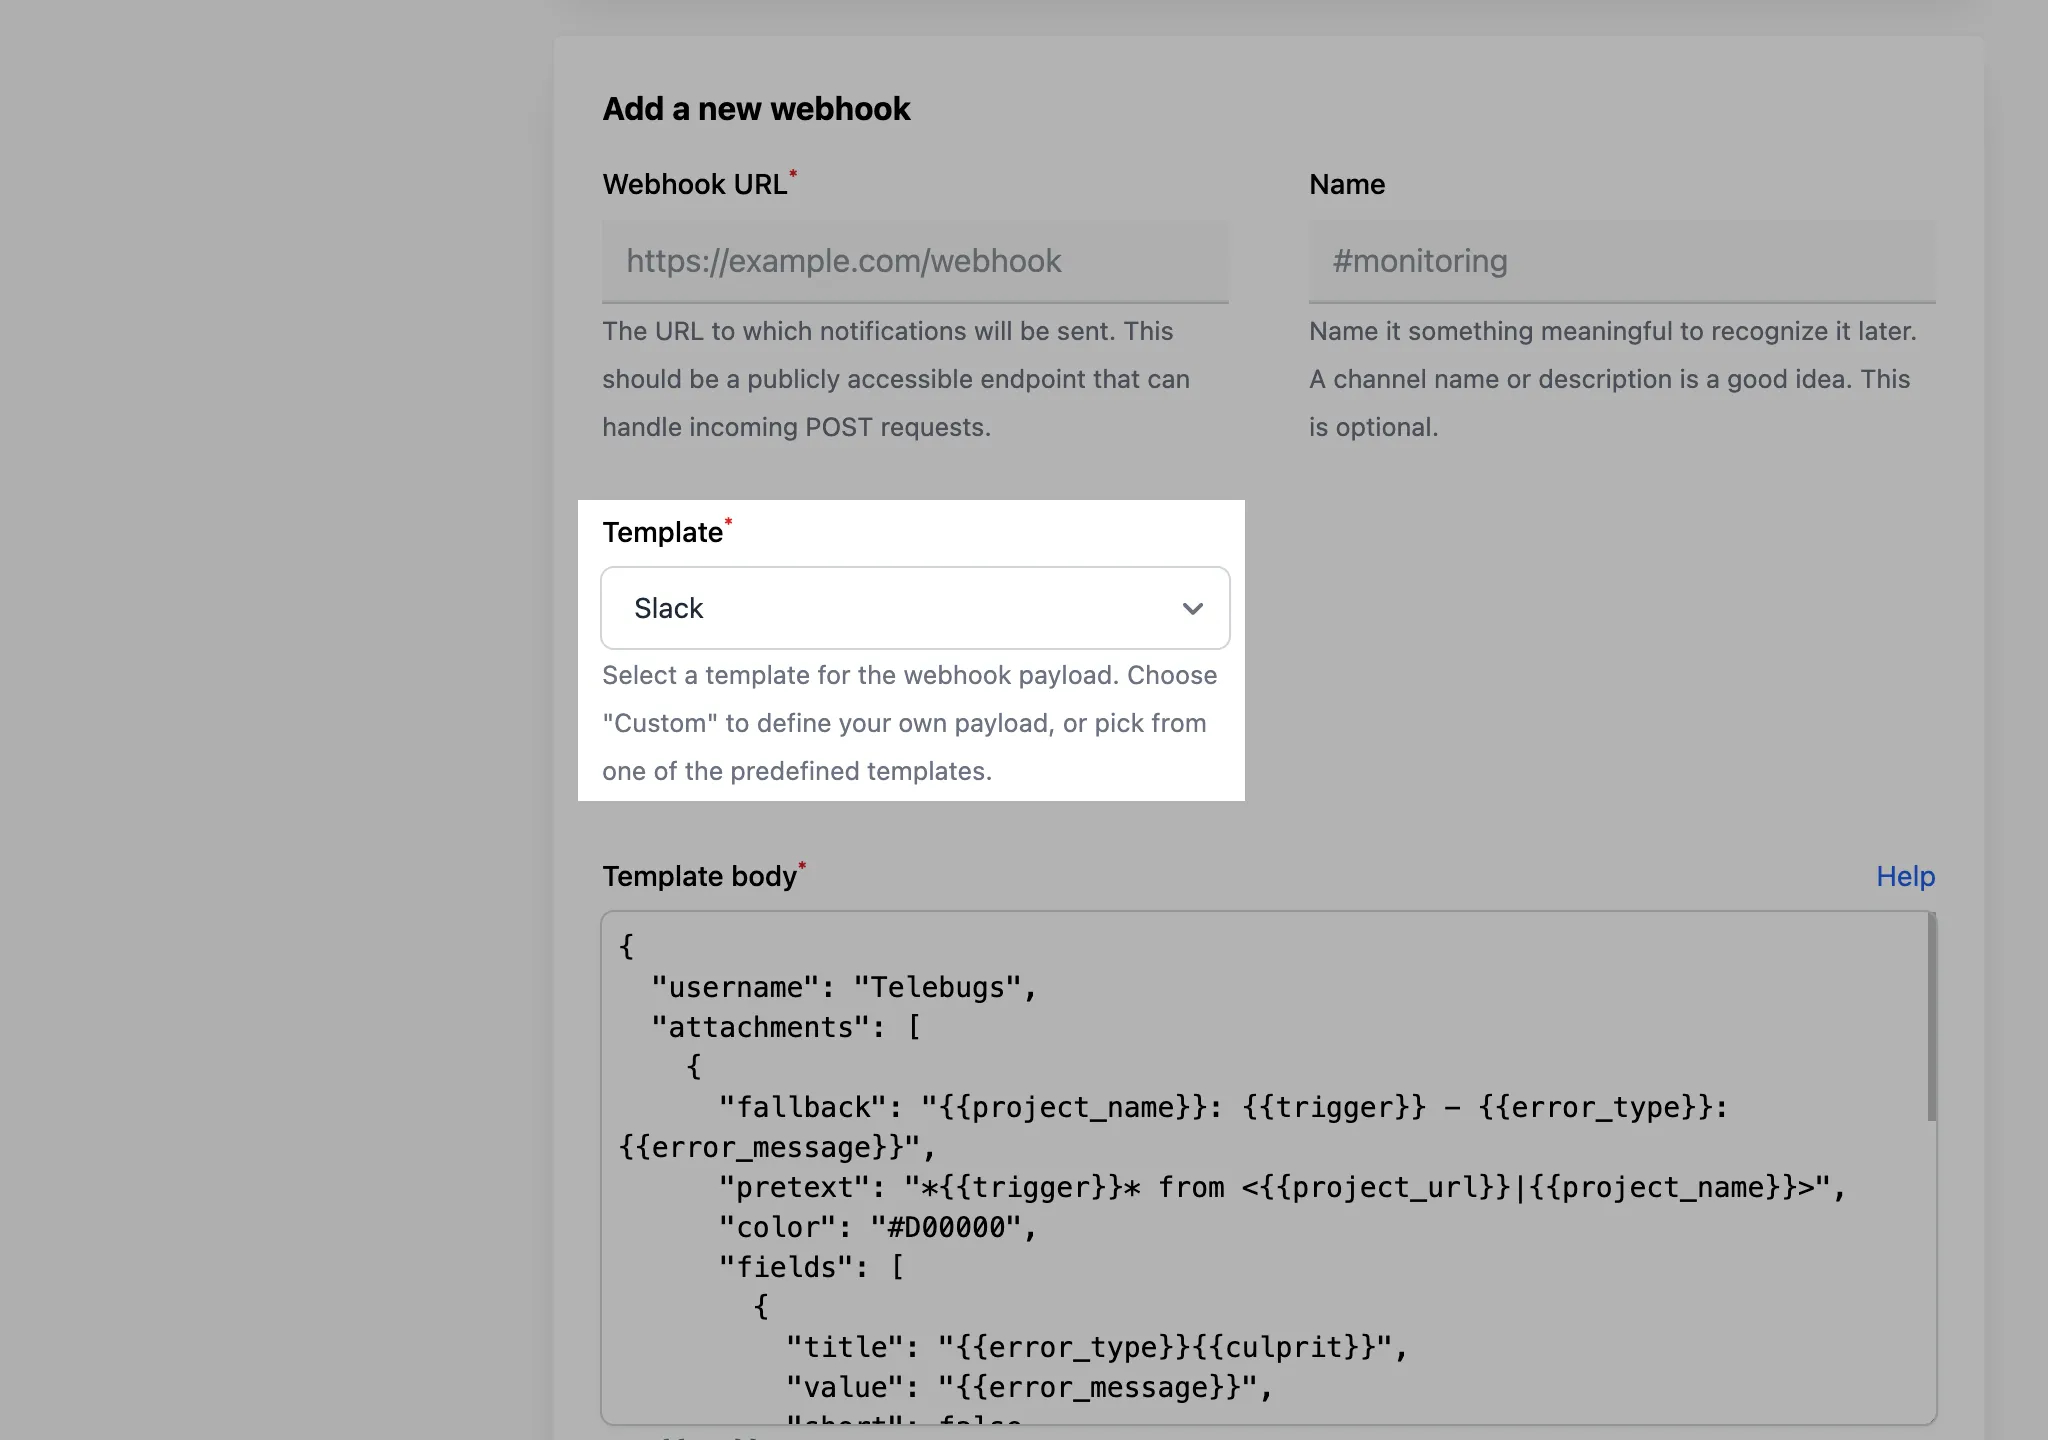
- Complete the Add a new webhook form with details such
as the webhook URL, name, template type, and template body, then click
Save webhook to apply your settings.
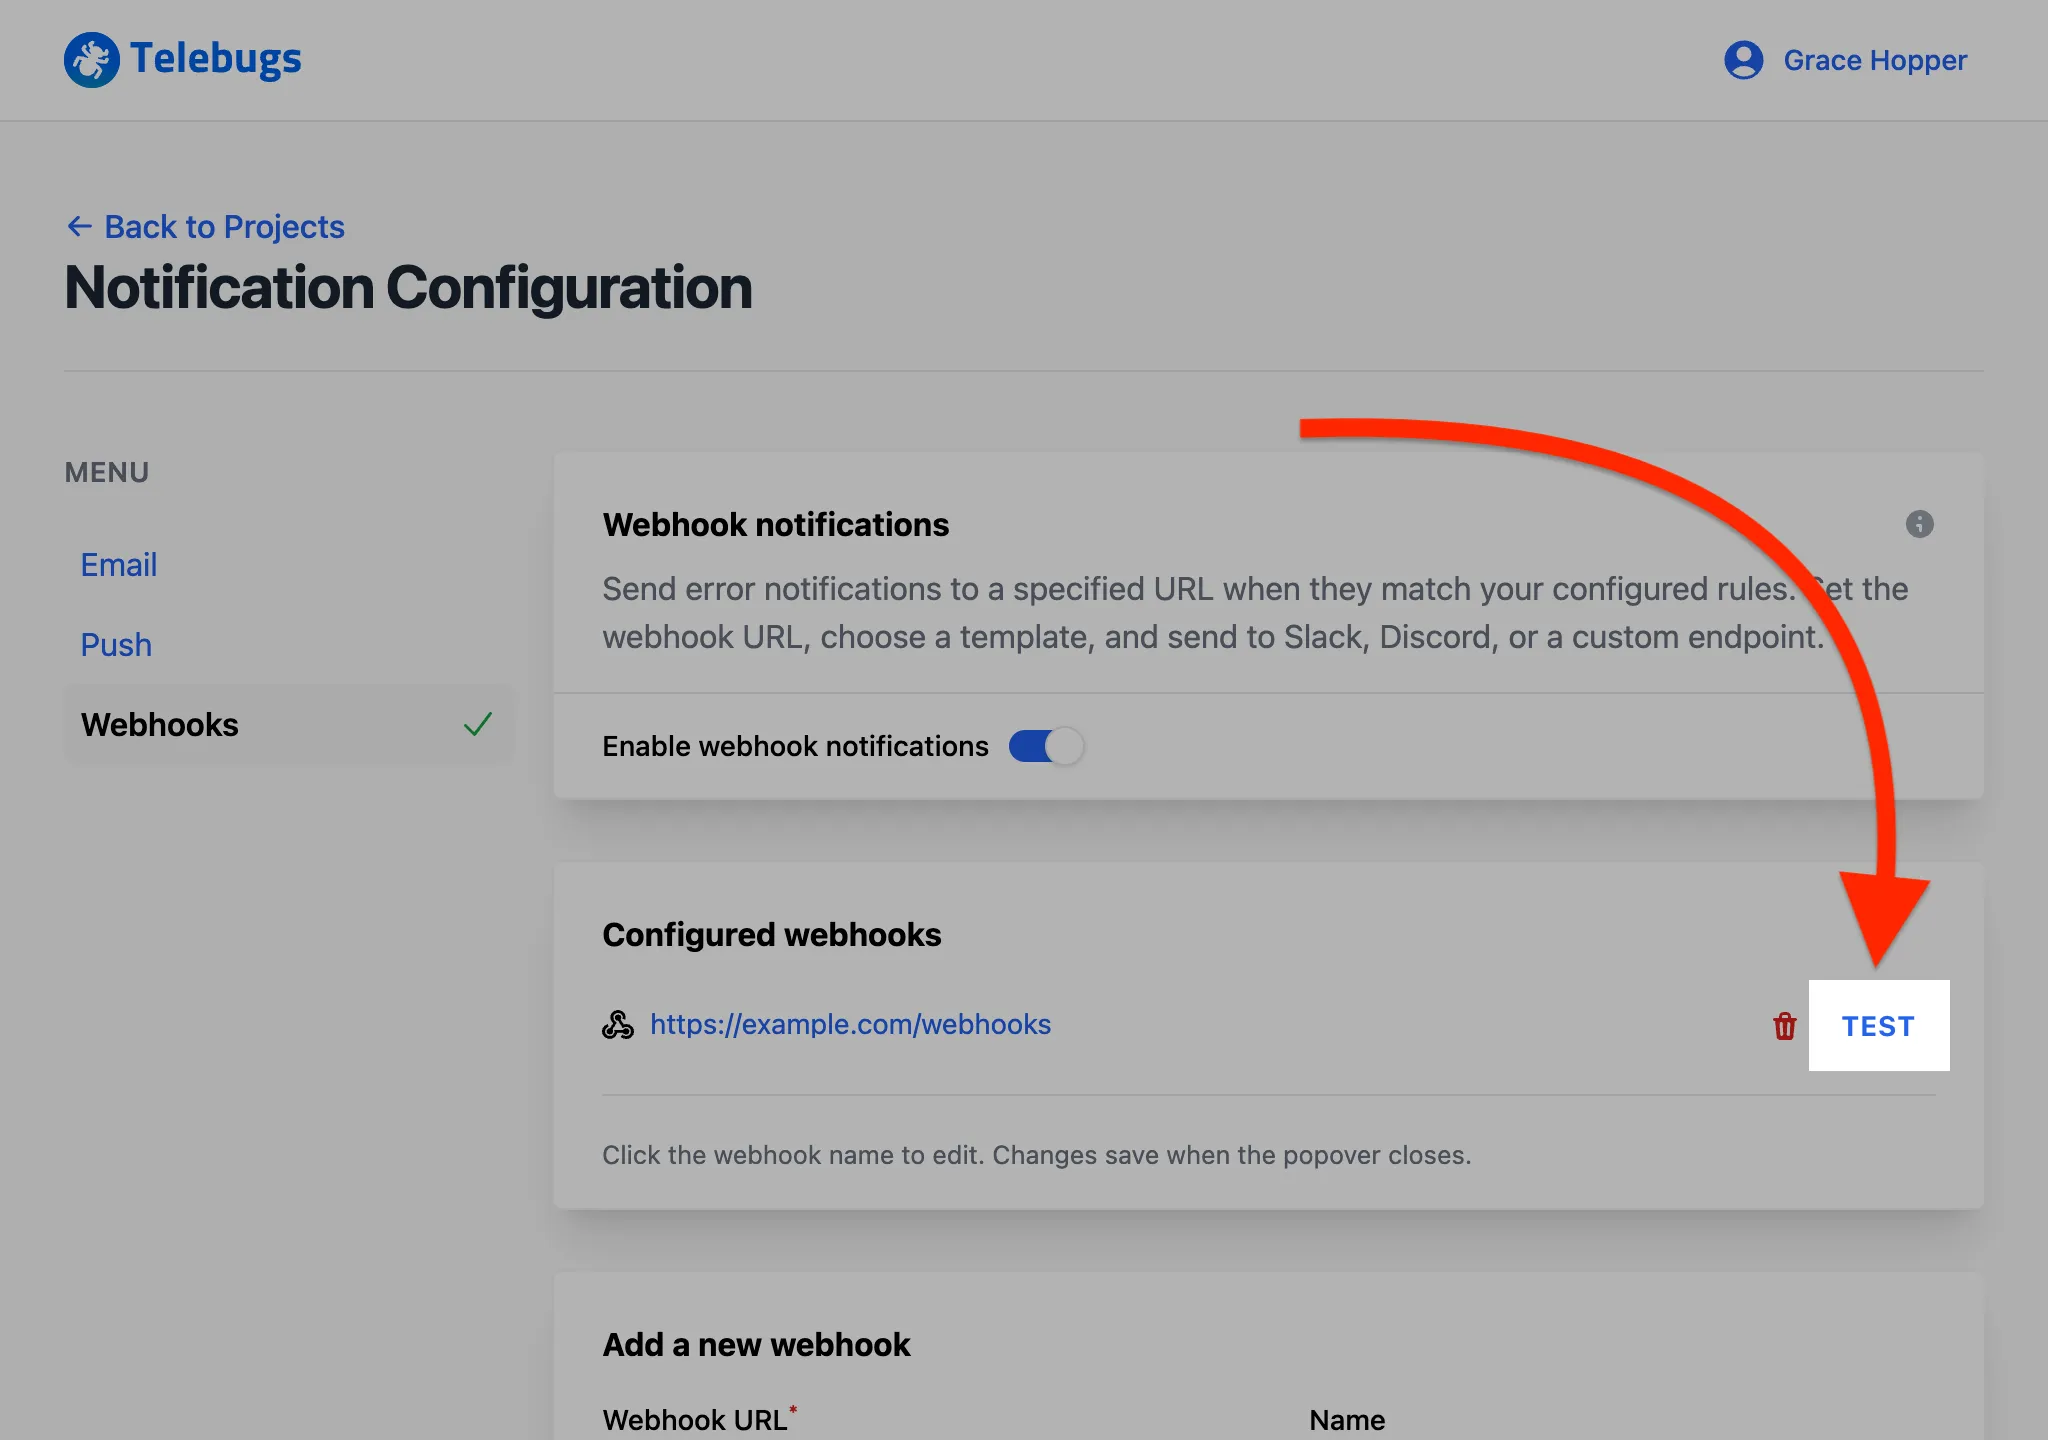
- Once saved, the webhook appears in the Configured webhooks
section.
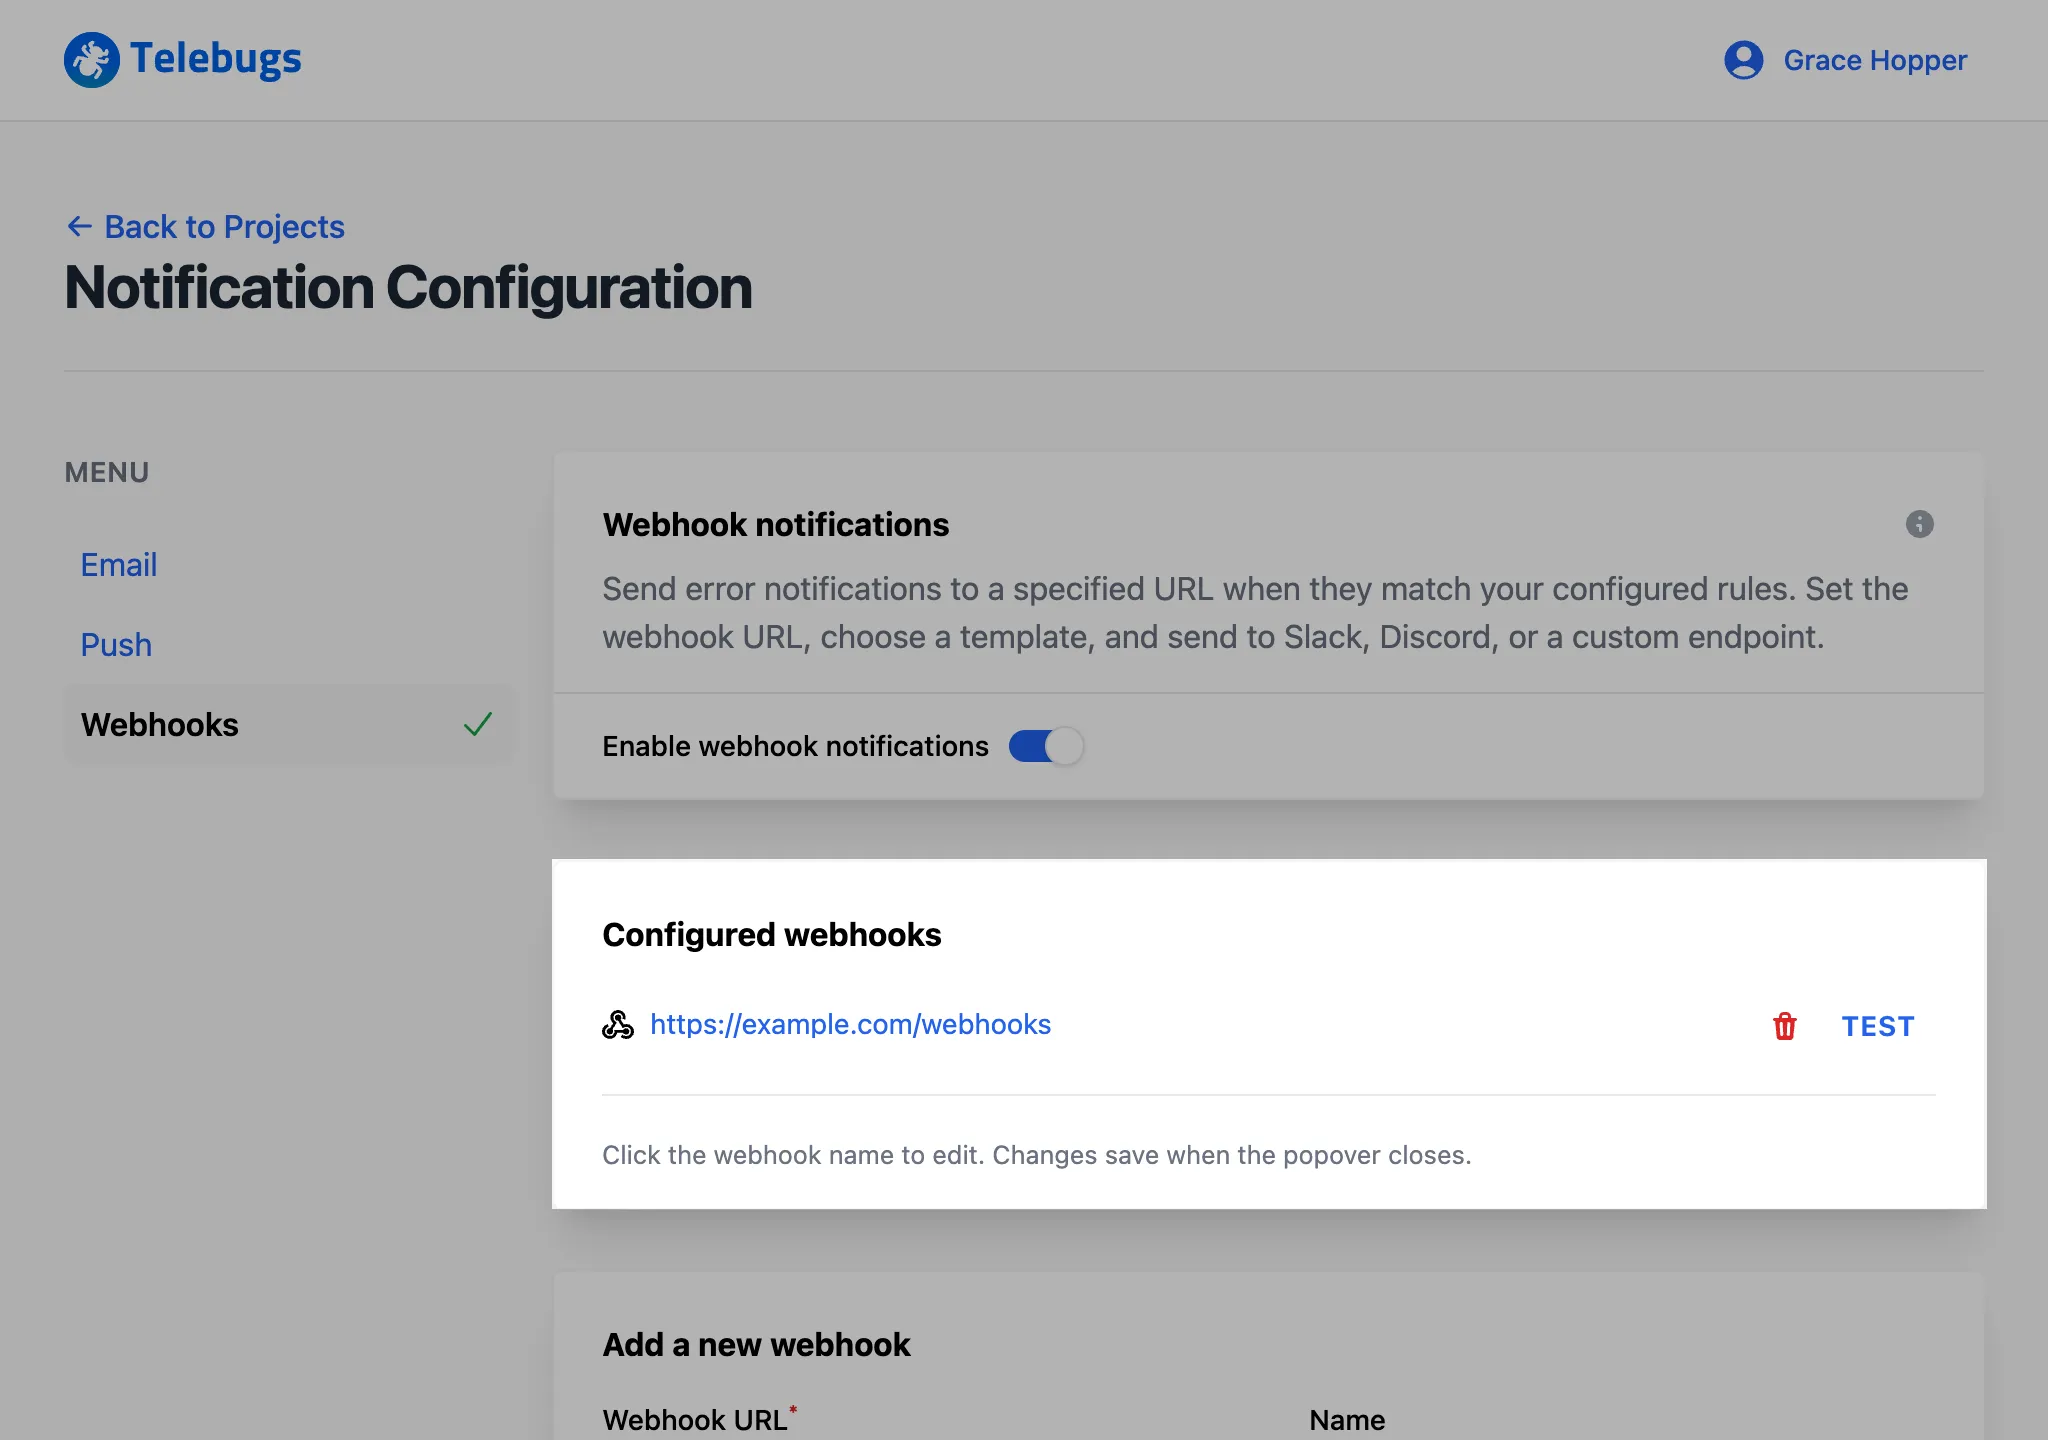
- To verify the webhook, click the Test button next to it in the
list. This sends a test payload to the specified URL.
- To edit a webhook, click its name in the Configured webhooks
section.
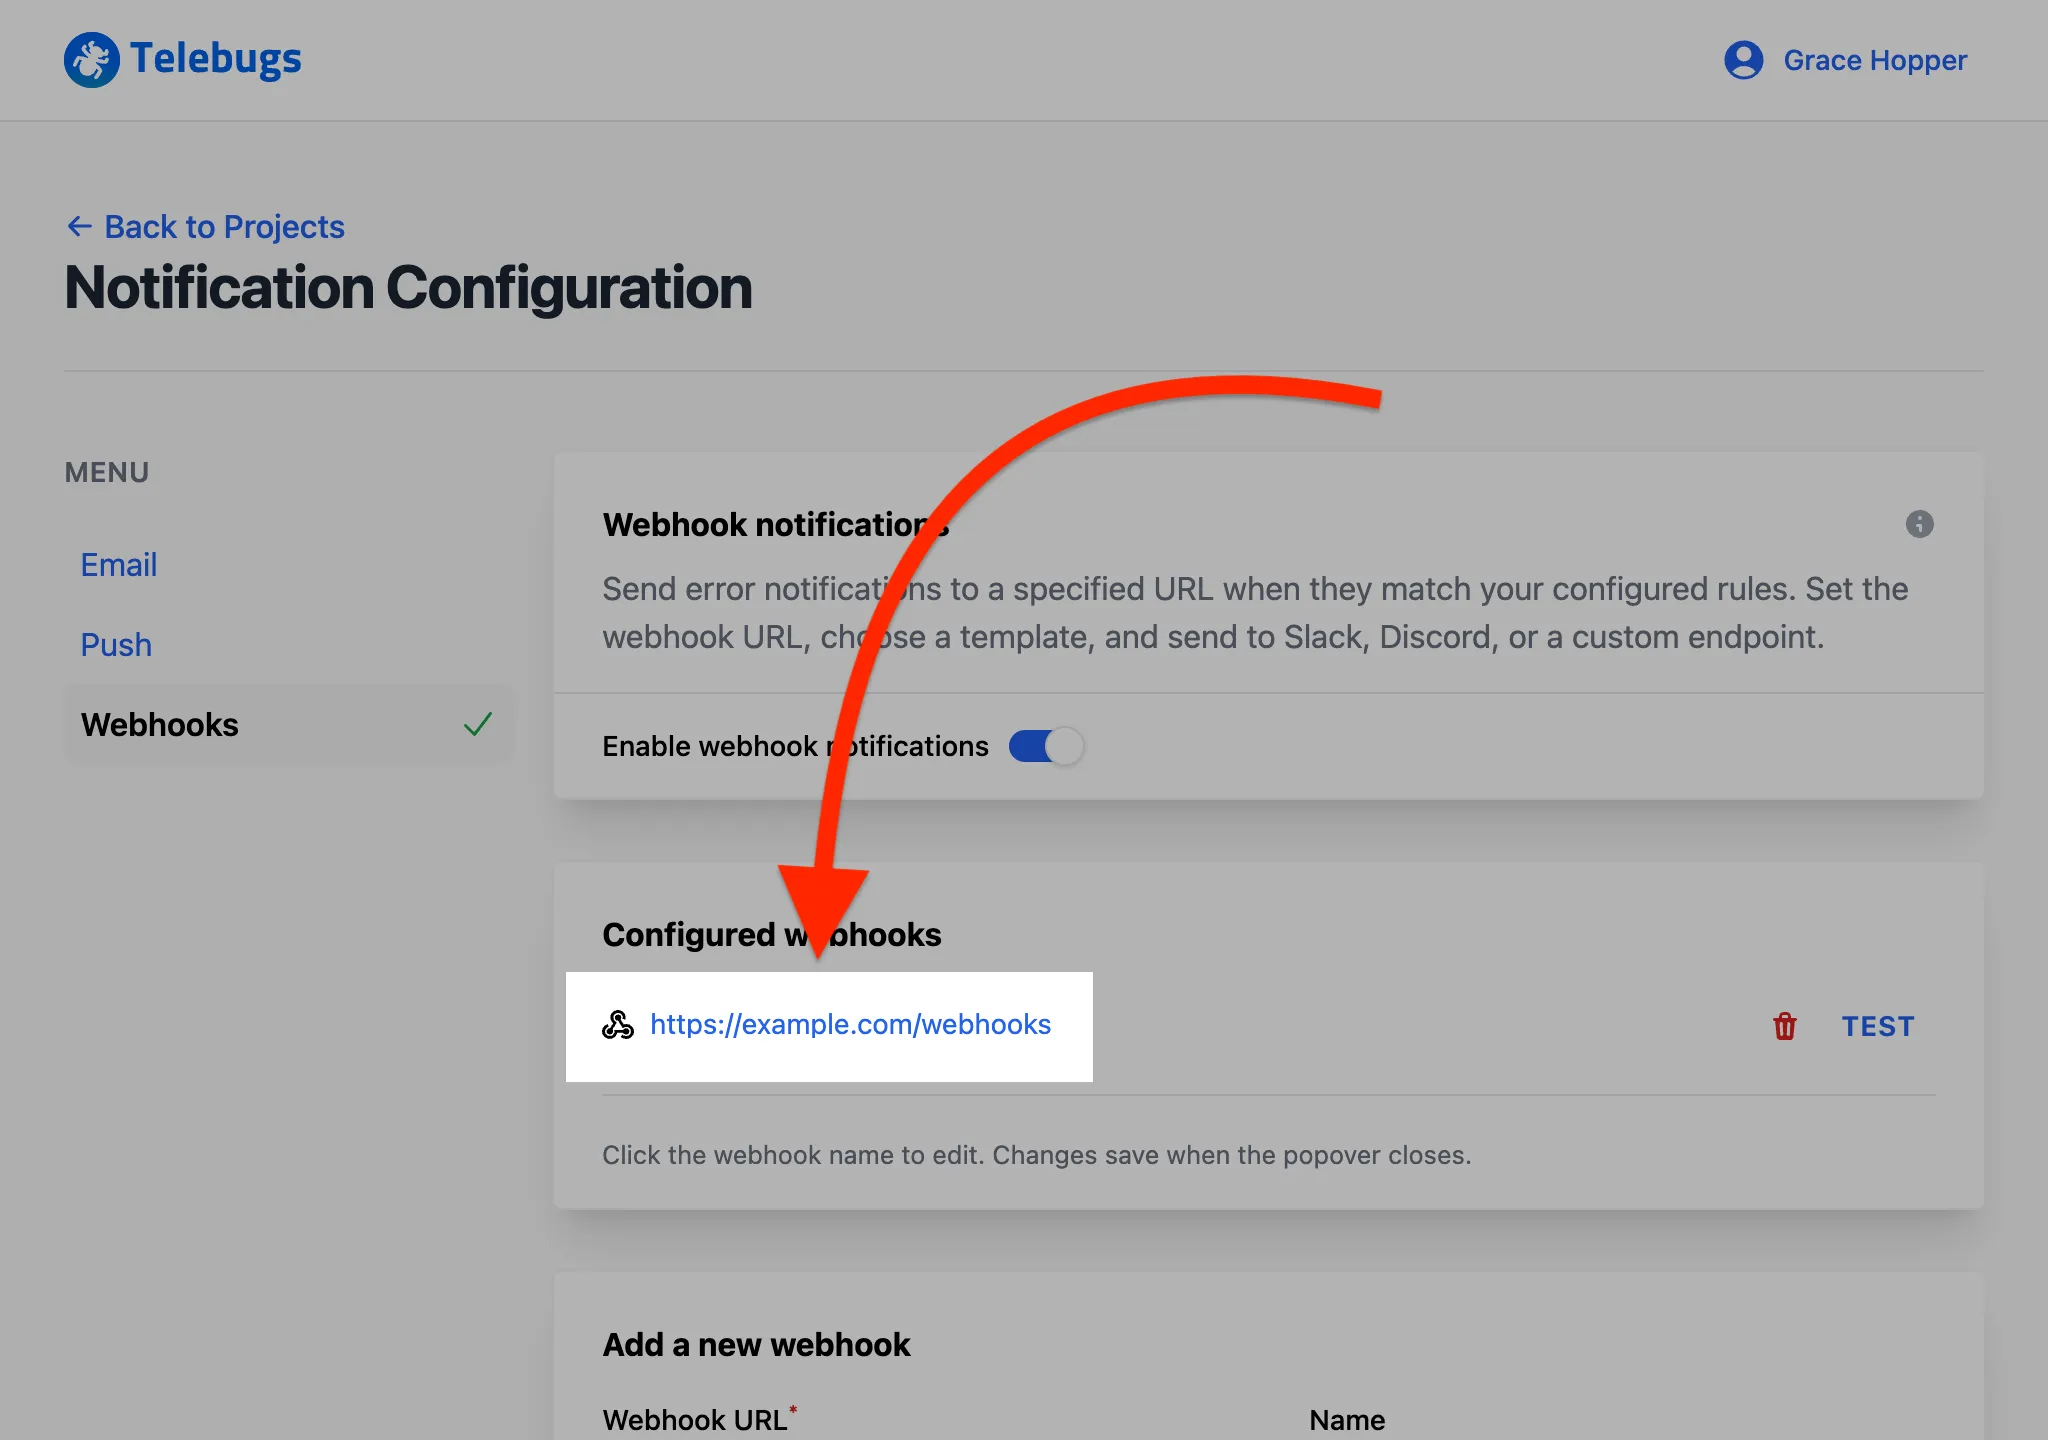
- A popup appears, allowing you to modify the name and template body.
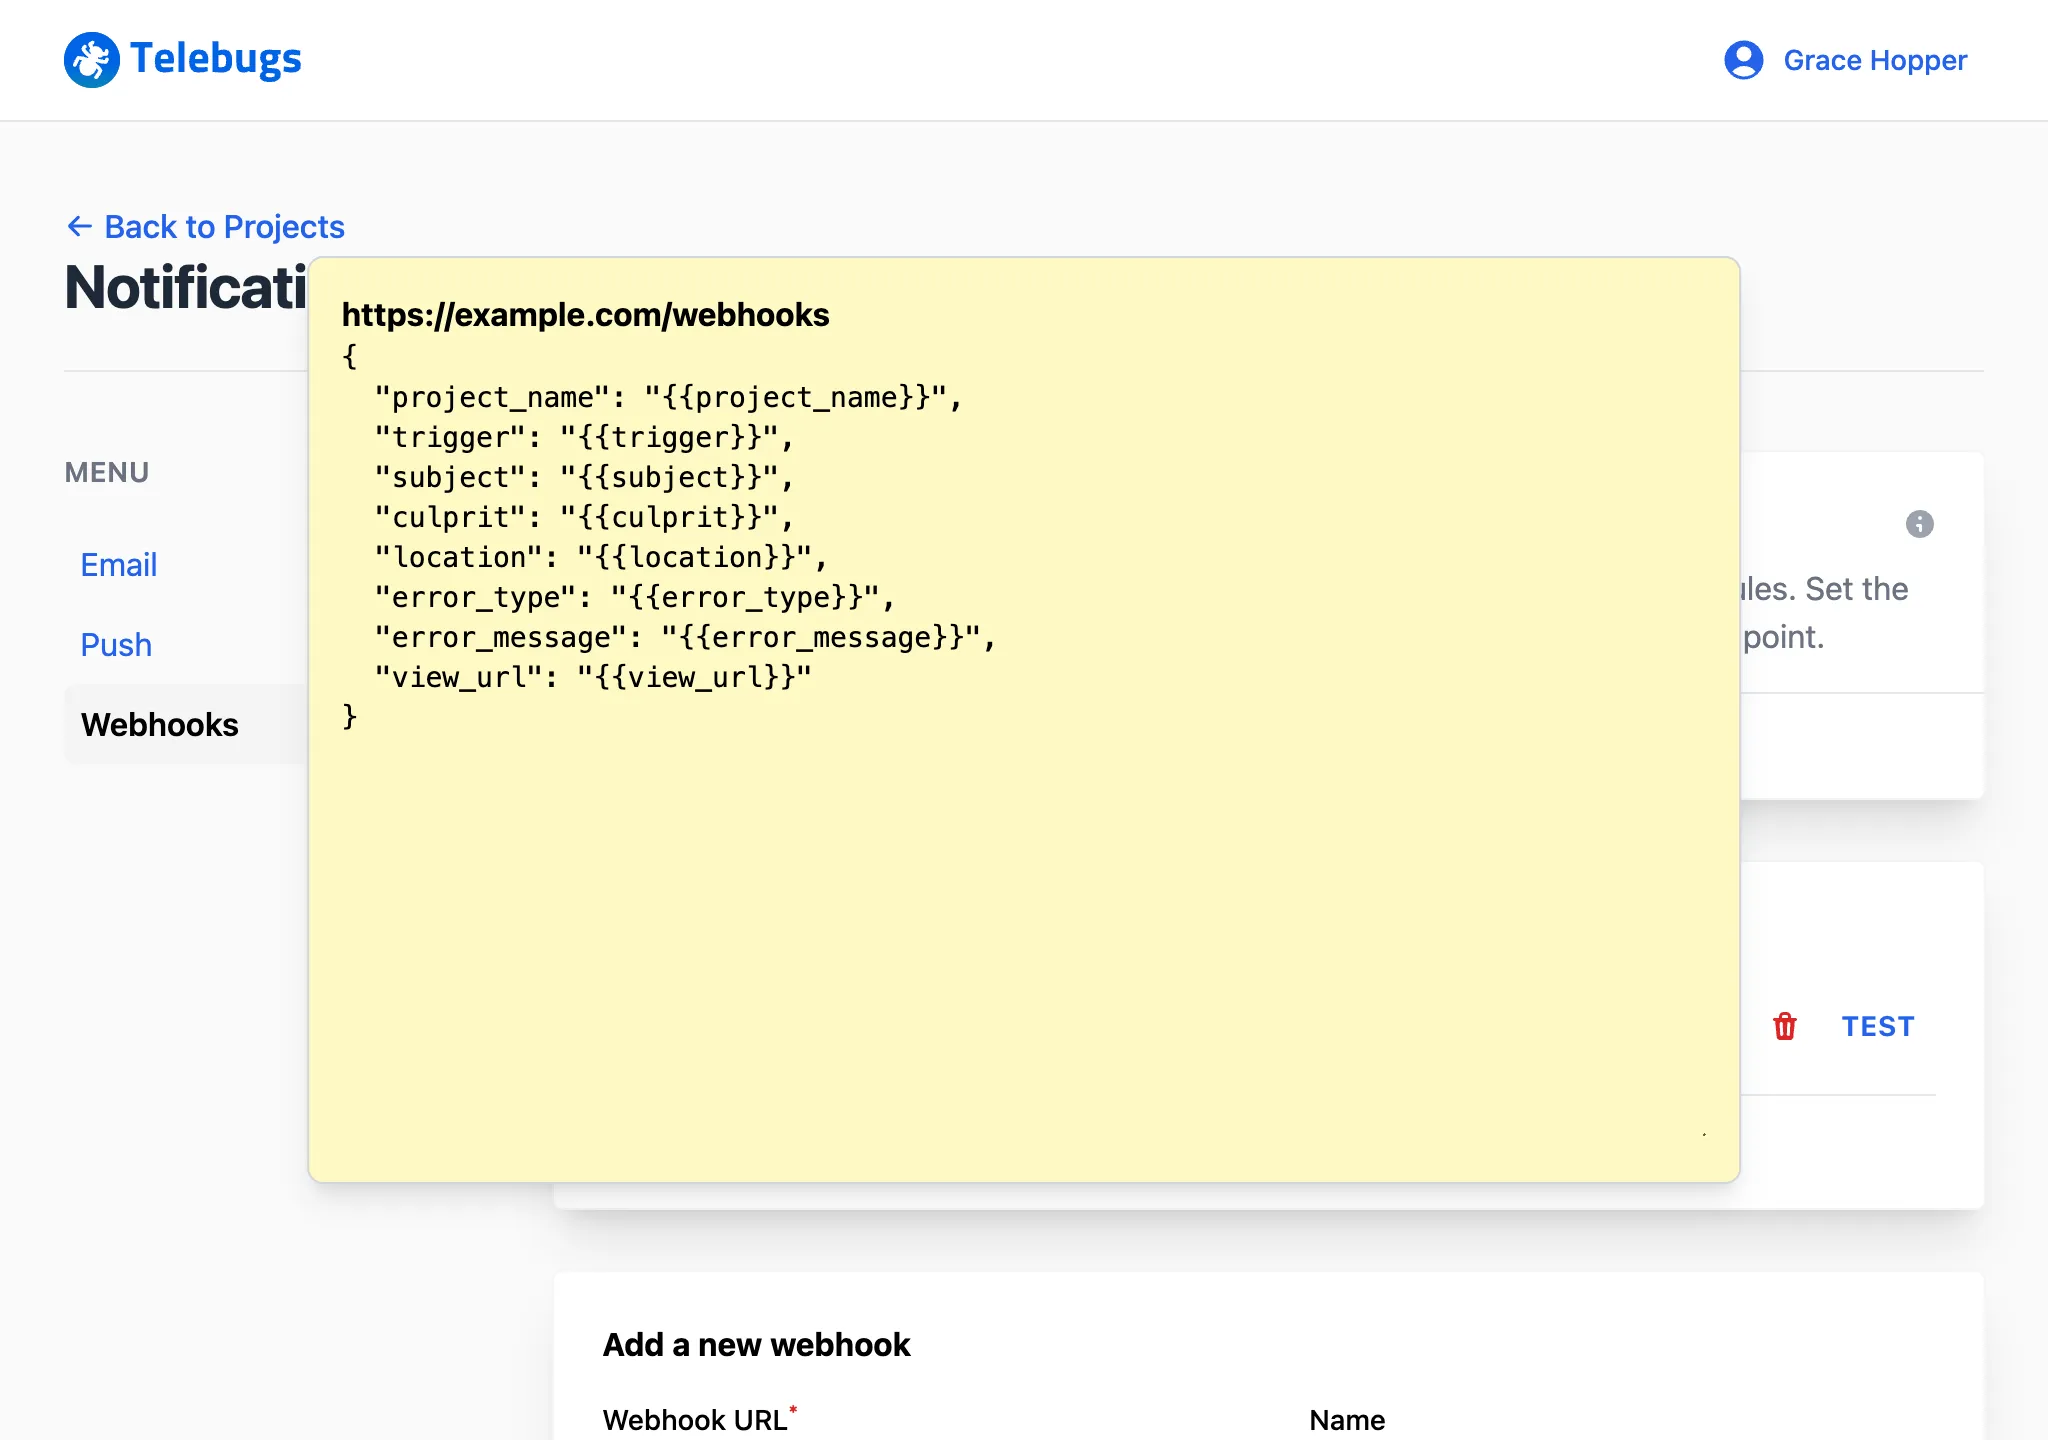
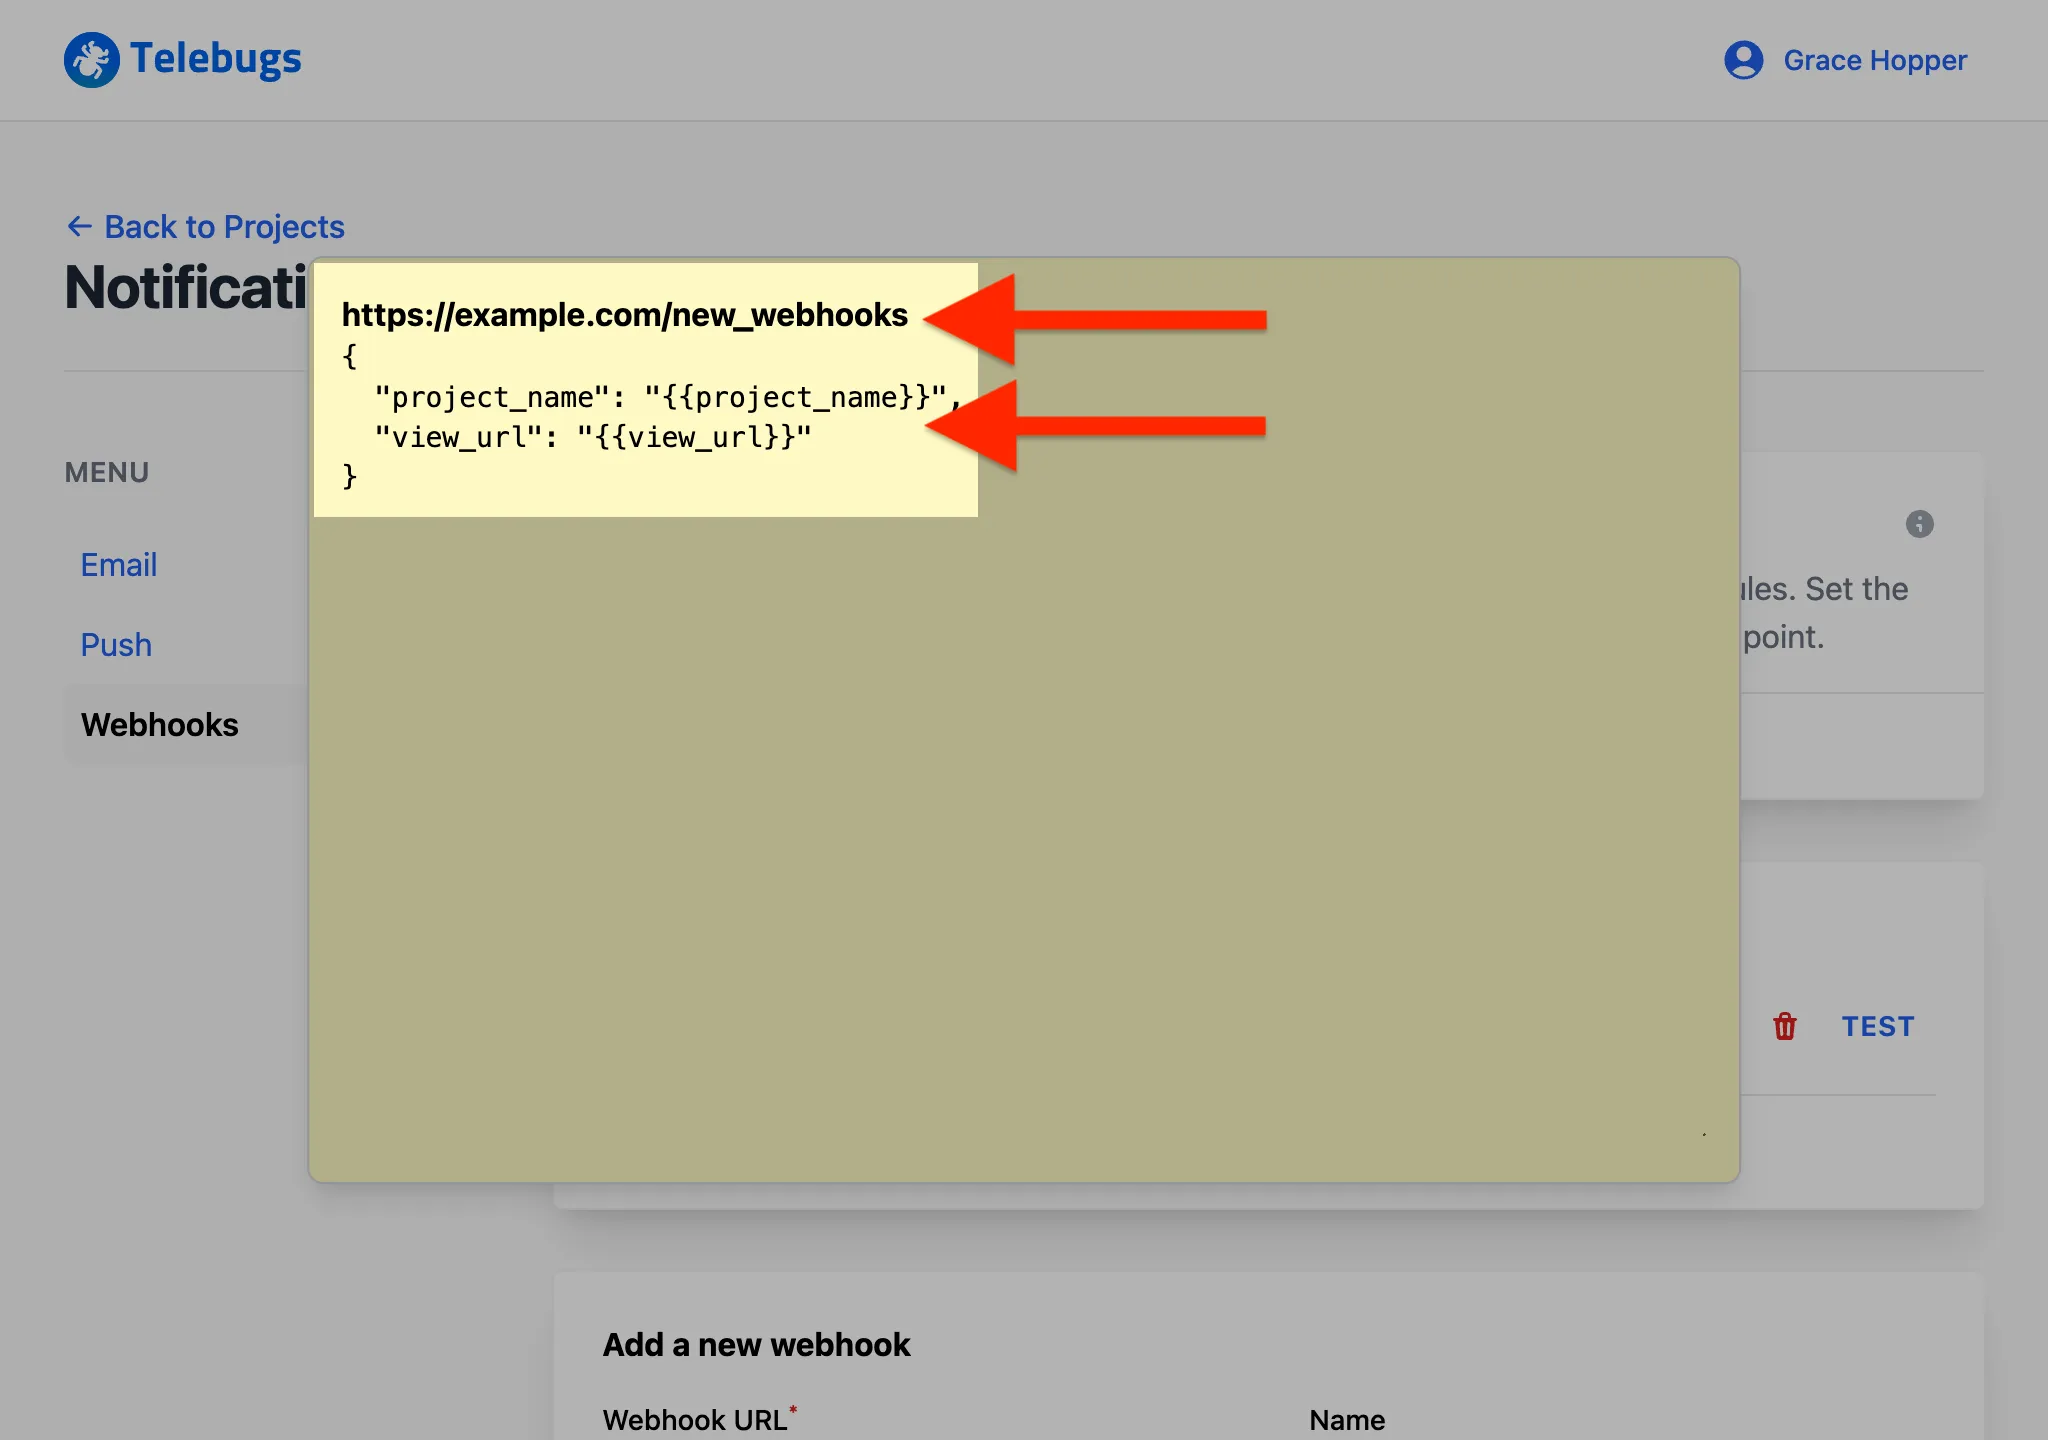
- You can edit webhook URL and template body directly in the popup. Close the
popup to save changes.
- When a real error occurs, Telebugs sends a notification to the webhook URL based on the project settings, including details like the error message and a link to the error report.
Add a new webhook form 
The Add a new webhook form defines the settings for each webhook. Complete the fields as follows:
- Webhook URL: Enter the URL where notifications will be sent. This must be a publicly accessible endpoint capable of handling POST requests. This field is required.
- Name: Provide an optional name to identify the webhook later, such as a channel name (e.g., "#monitoring") or a description.
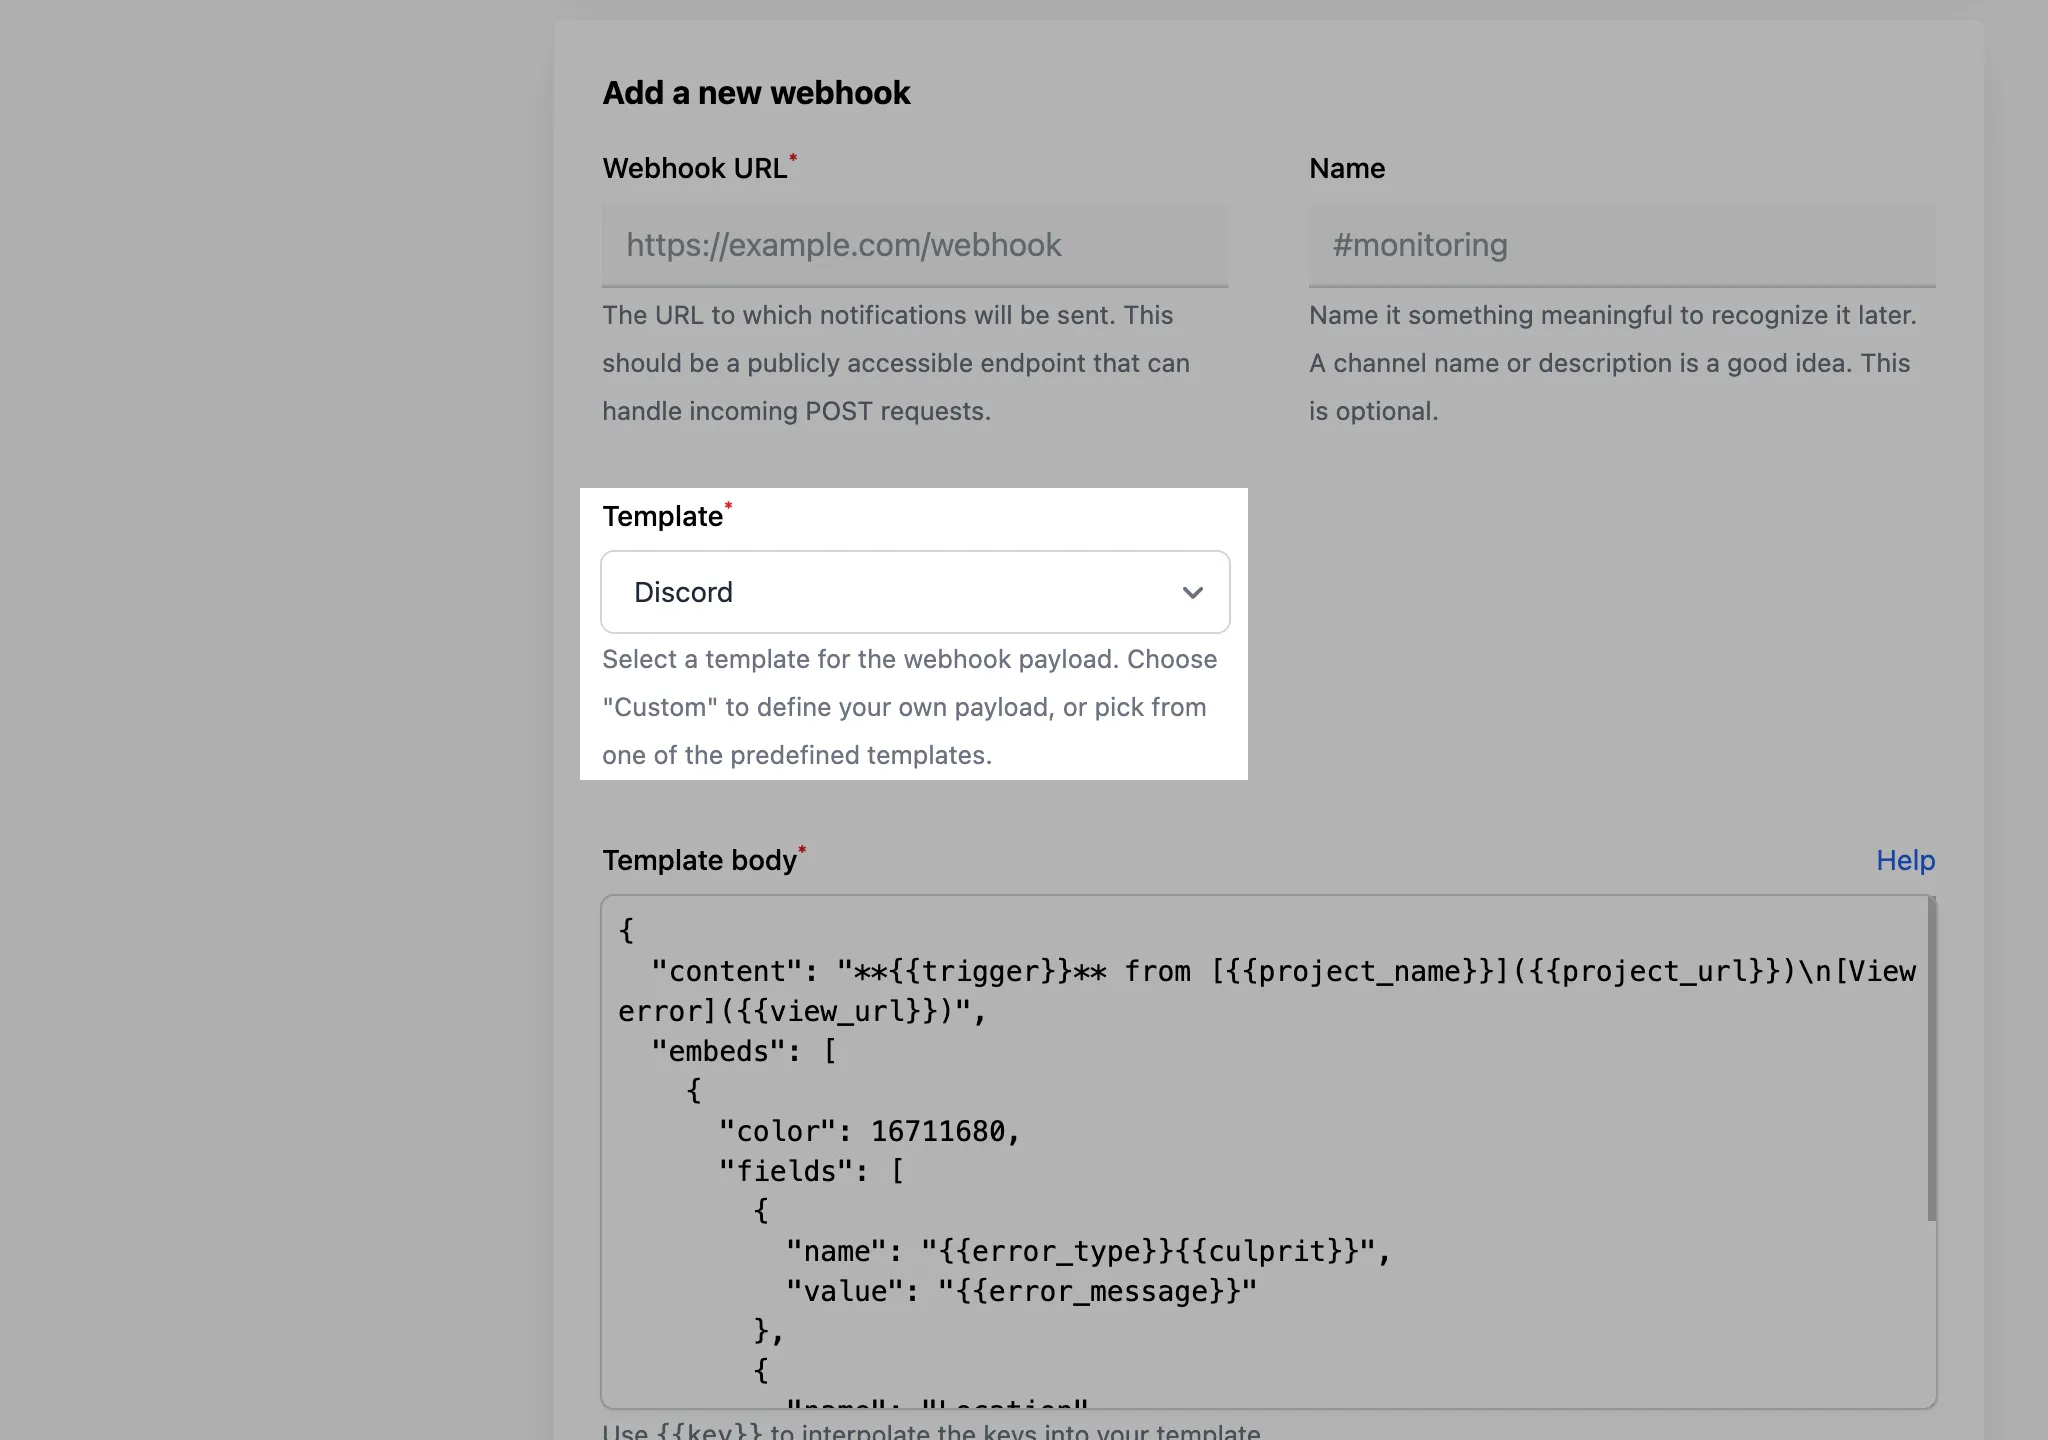
- Template: Select the payload template type from the dropdown: Slack, Discord, or Custom. Predefined templates auto-fill the template body, while "Custom" allows manual payload creation. This field is required.
- Template body: Define the JSON payload sent to the webhook URL. For predefined templates, this field pre-populates with a default structure. For custom templates, enter your own JSON using allowed interpolation keys. This field is required.
Webhook template body placeholders 
In the template body, use placeholders like {{key}} to insert dynamic
values. The following keys are available:
project_name: The project name (e.g., "Backend", "example.com").trigger: The event triggering the notification (e.g., "error", "reoccurrence", "error frequency exceeded").subject: A brief error description (e.g., "NoMethodError in ScoresController#create").culprit: The code location of the error (e.g., "ScoresController#create").location: The error’s location (e.g., file path or module).error_type: The error type (e.g., "NoMethodError", "Exception").error_message: The detailed error message (e.g., "undefined method ‘+’ for nil").project_url: The project’s URL in Telebugs (e.g., "https://tests.telebugs.com/projects/7").view_url: The URL to the error report (e.g., "https://tests.telebugs.com/errors/107").
Click the Help button next to the template body field for links to resources on webhooks, Slack, and Discord integration.
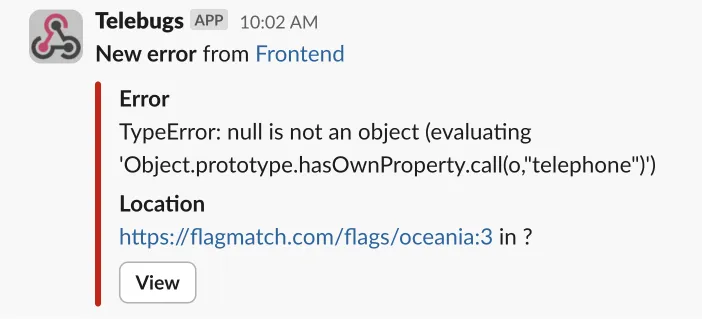
10.3.1 Slack 
Slack webhooks allow Telebugs to send error notifications directly to a Slack channel or user. This integration provides real-time alerts, enabling teams to monitor and respond to errors efficiently.
Configuring a Slack webhook 
To configure a Slack webhook in Telebugs, follow these steps:
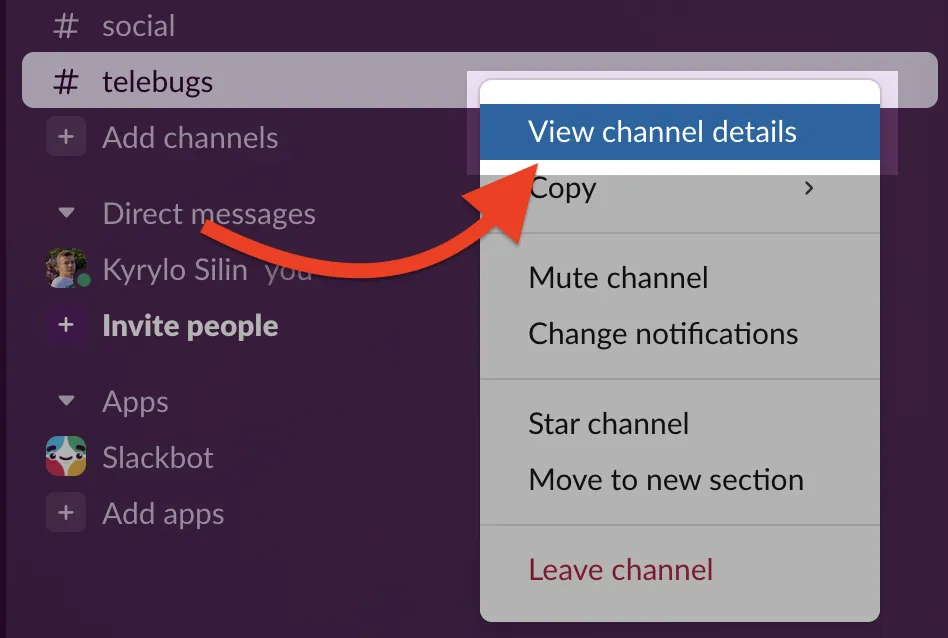
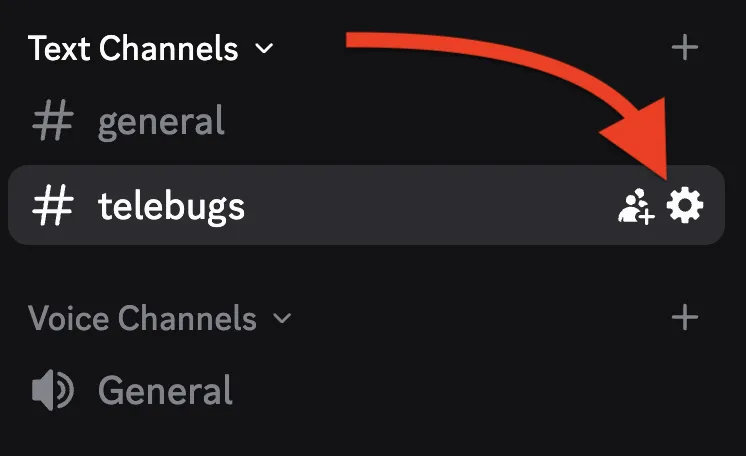
- In your Slack workspace, right-click on a channel name and select
View channel details.
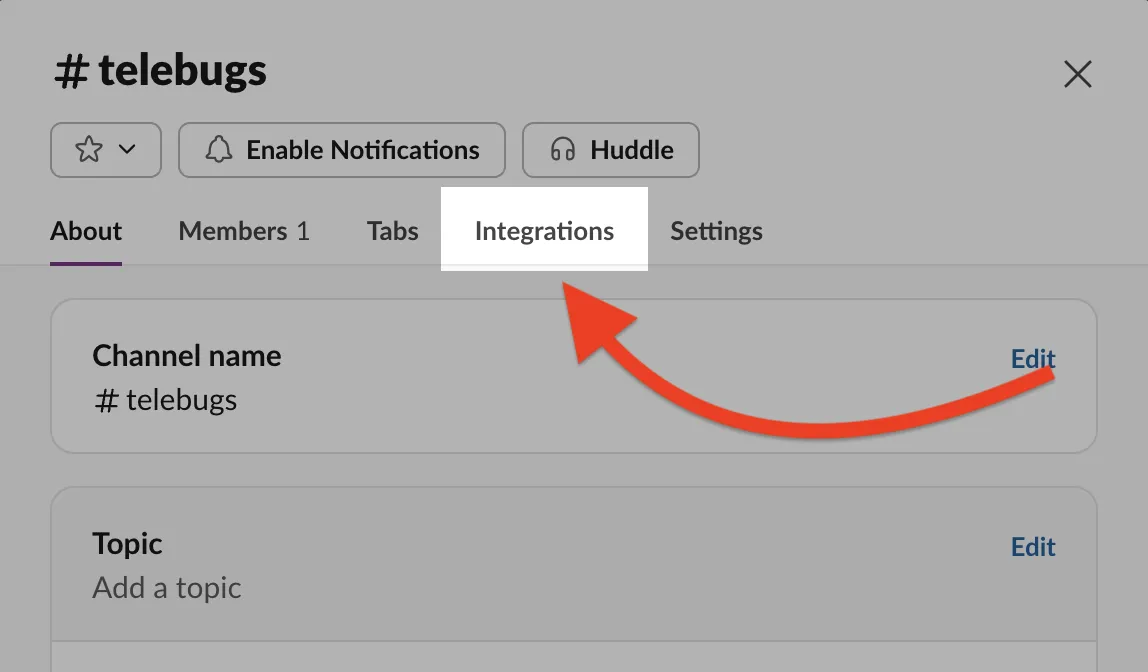
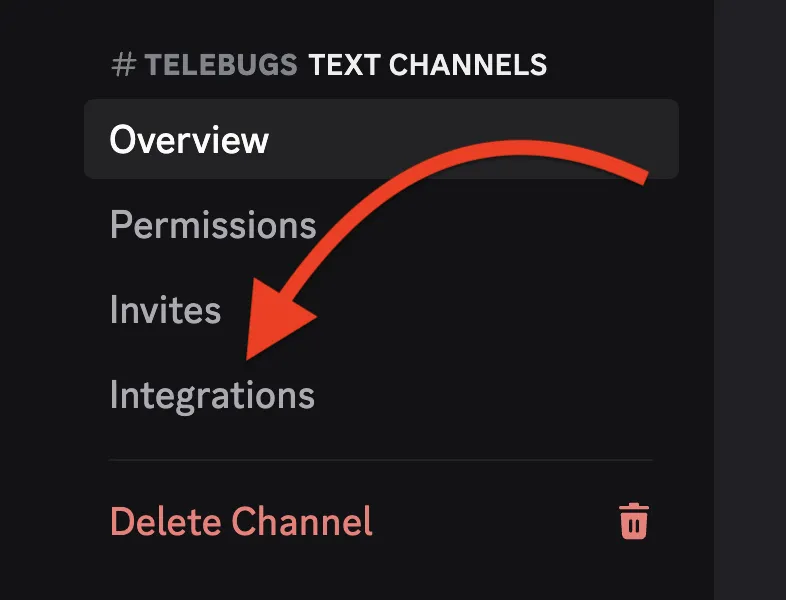
- Select Integrations tab to add the app.
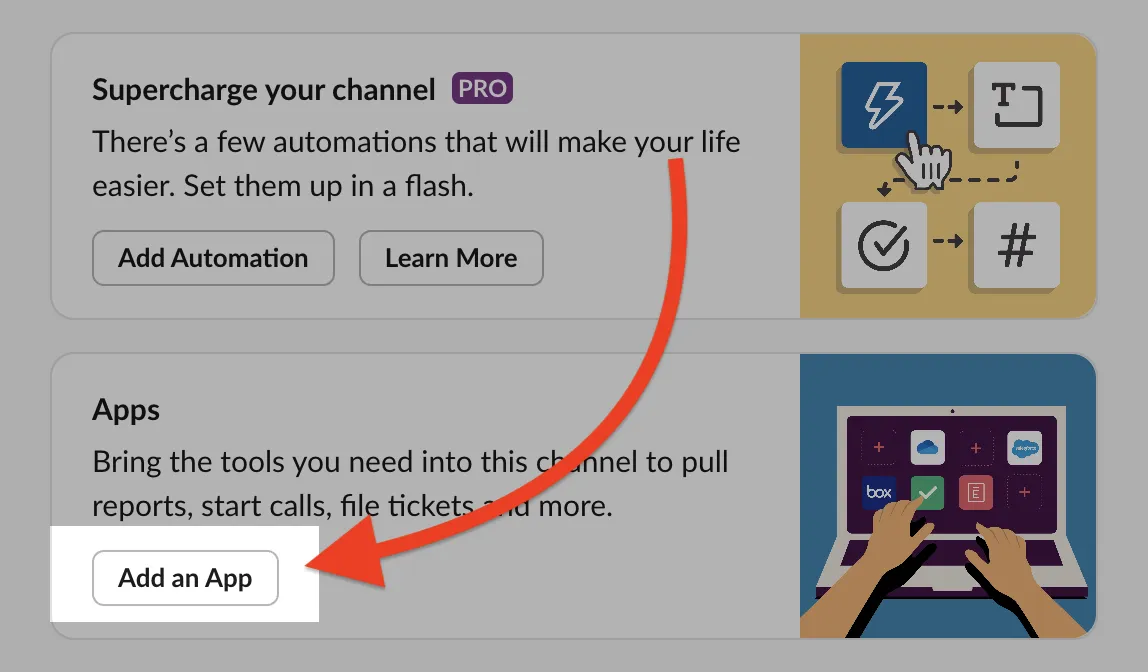
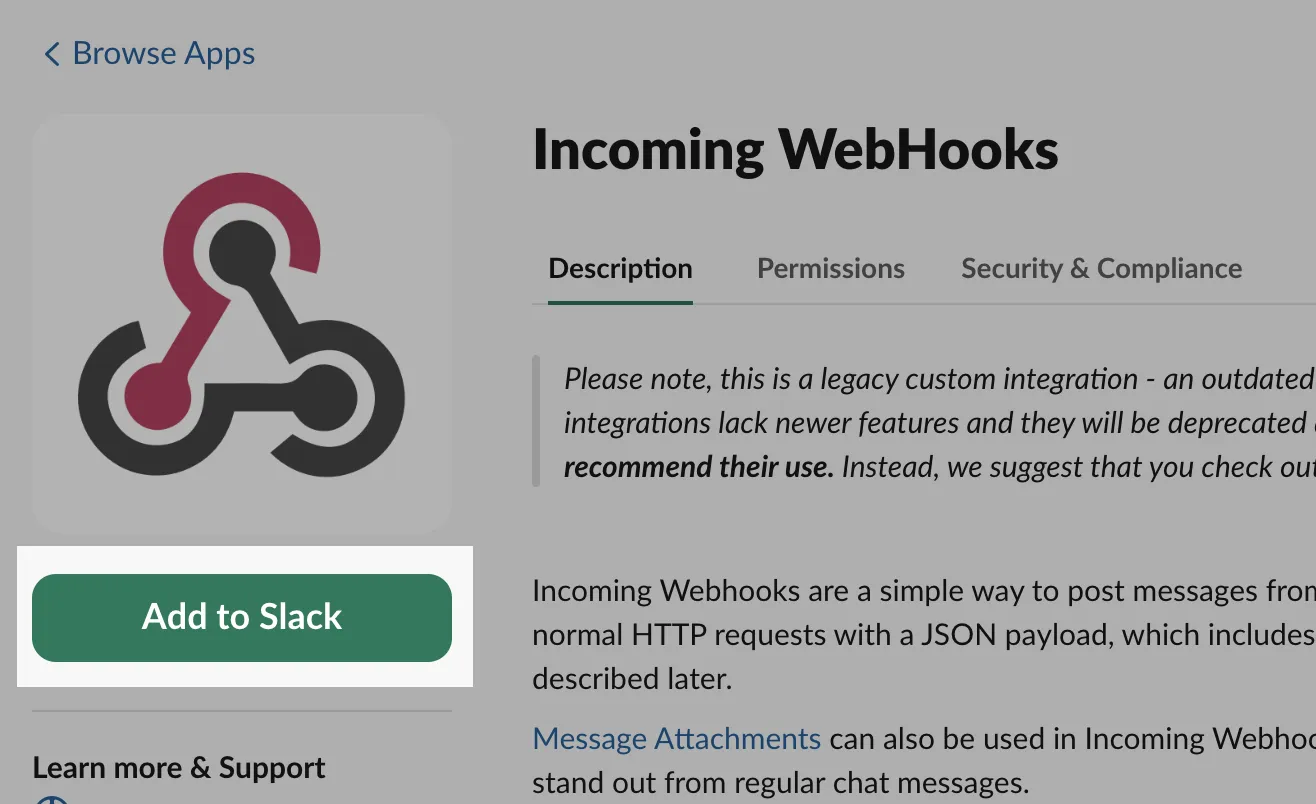
- Click the Add an app button to open the Slack App Directory.
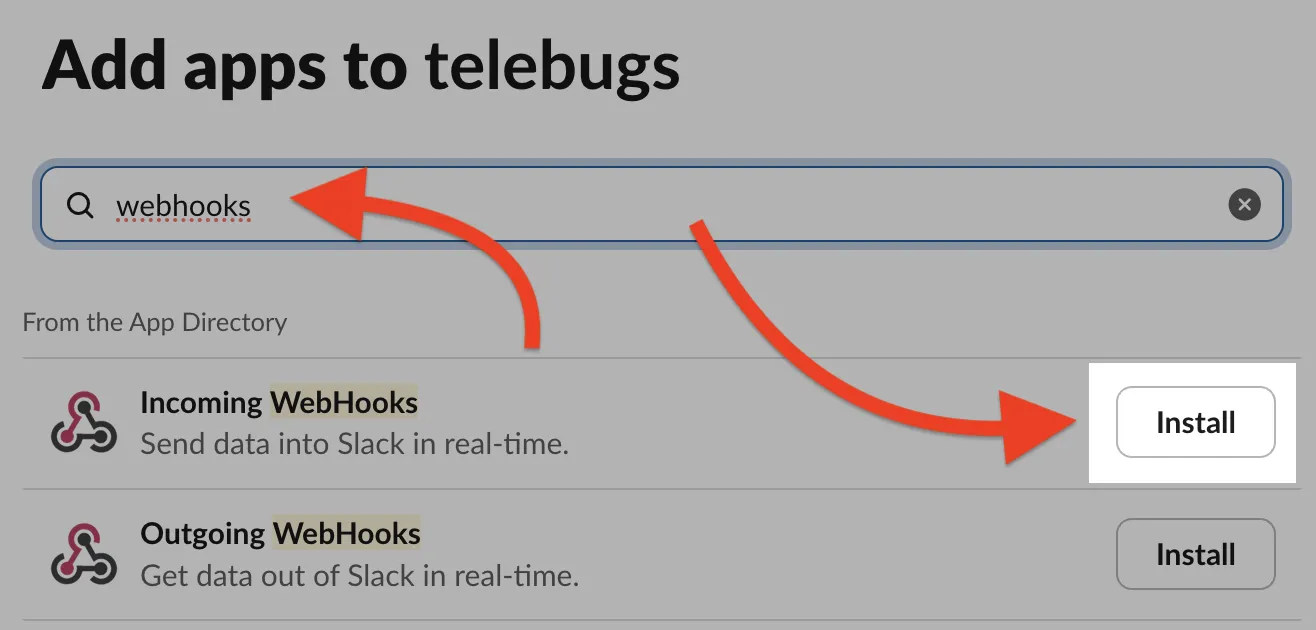
- Search for Incoming Webhooks and select it from the search
results, then click Install.
- Click Add to Slack to create a new webhook configuration.
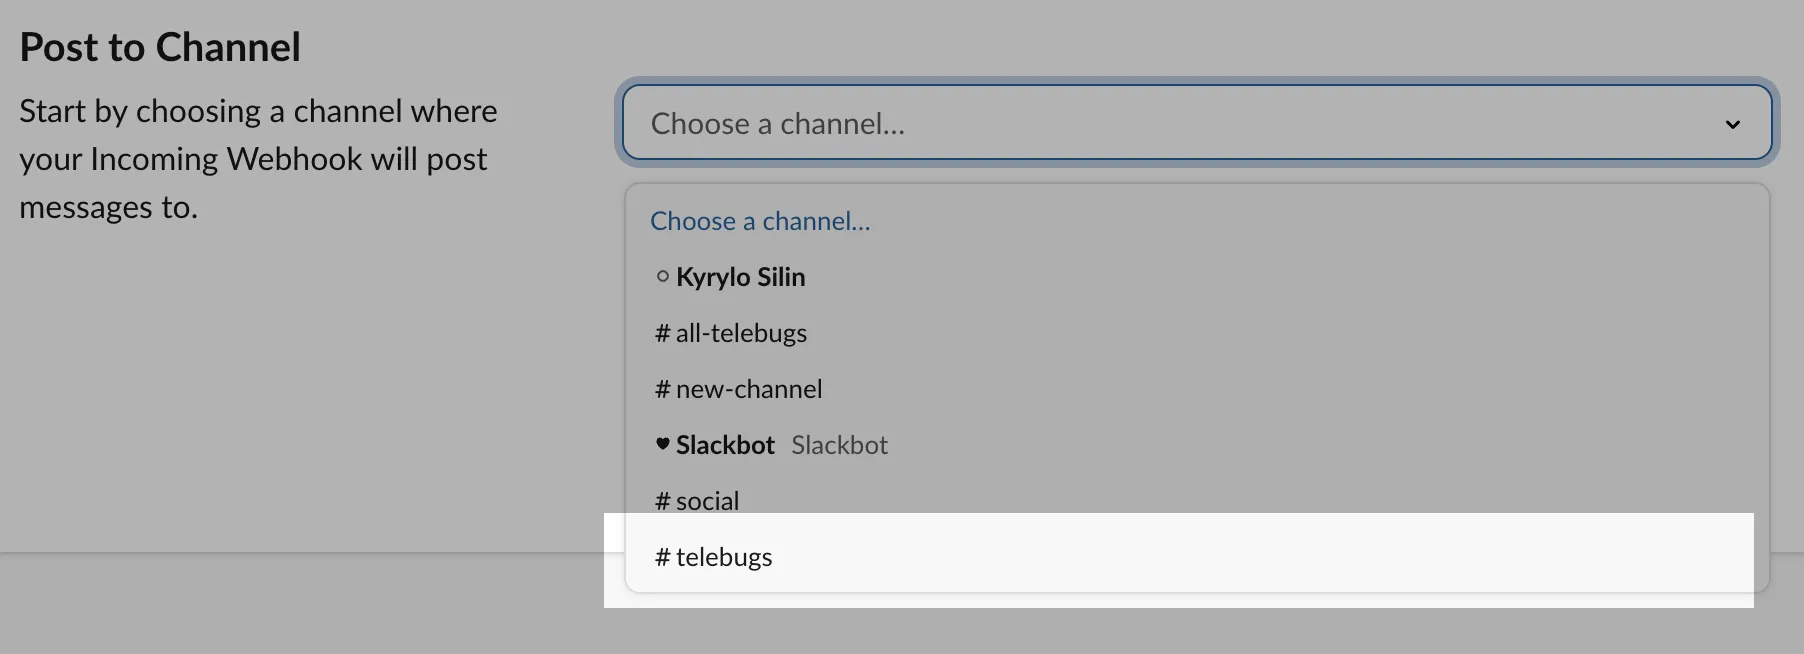
- Choose the channel where notifications will be posted (e.g., "#telebugs")
from the Post to Channel dropdown.
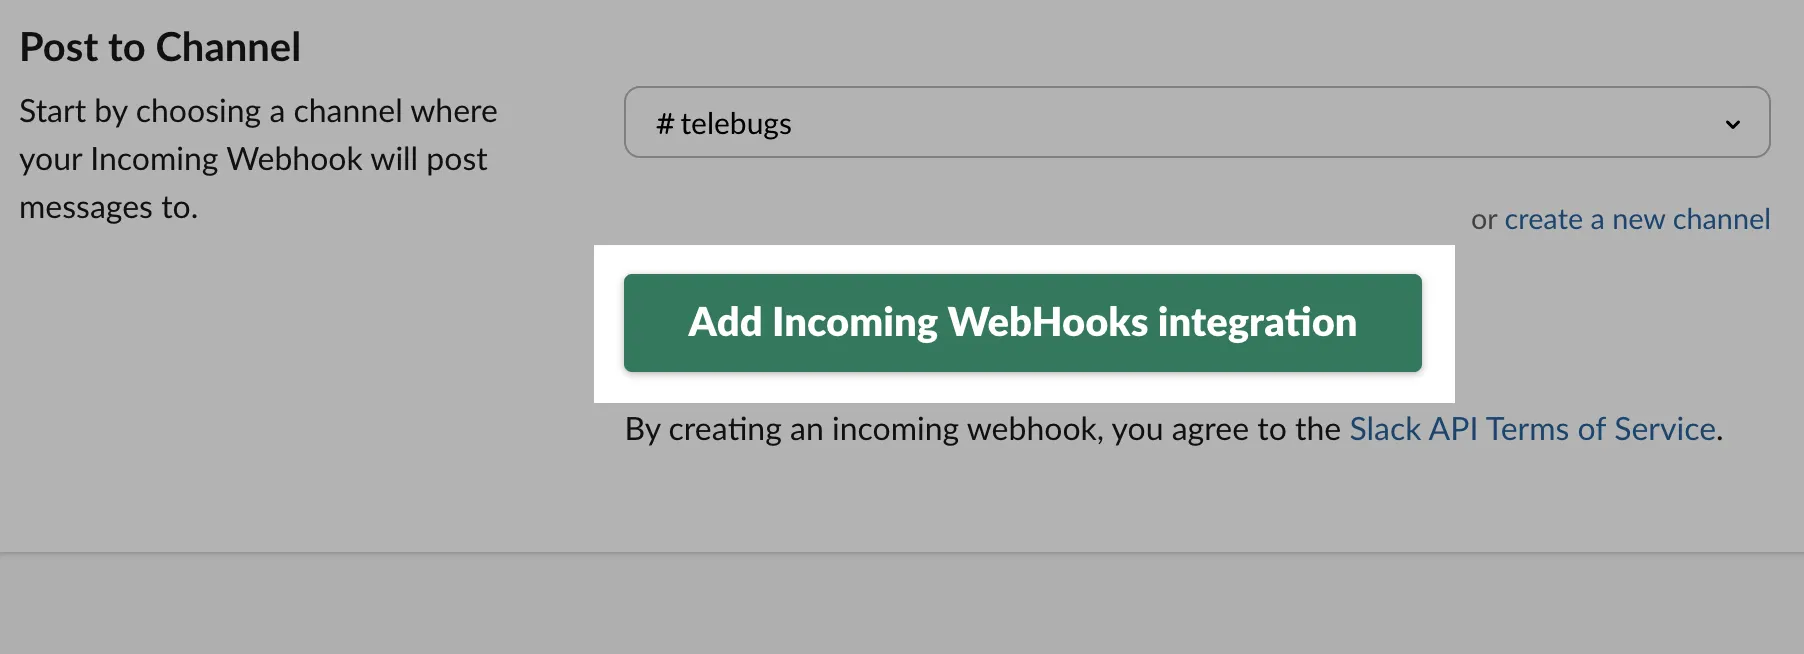
- Confirm the channel and click Add Incoming Webhooks integration.
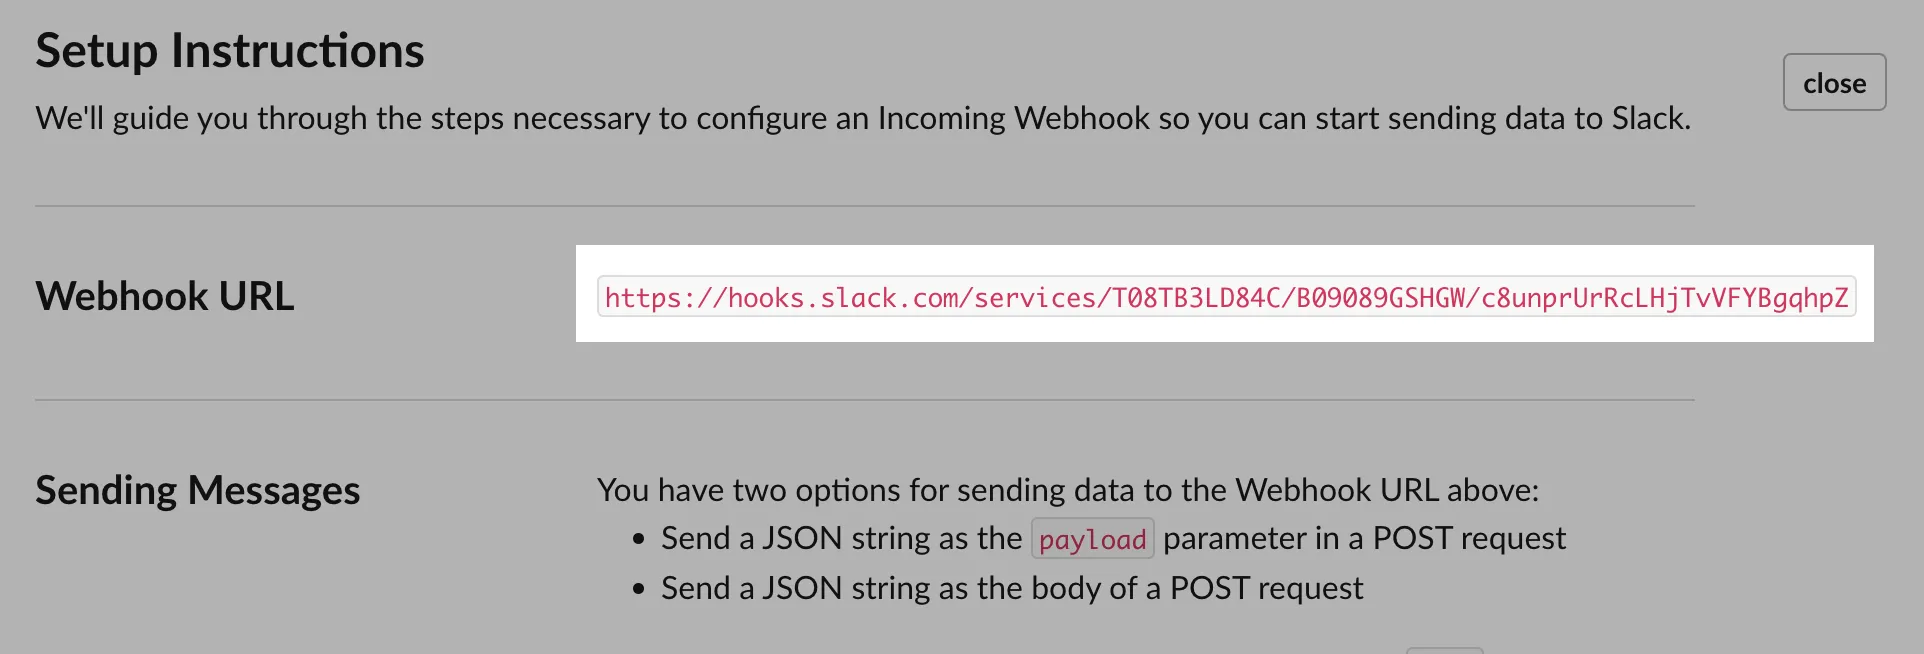
- Copy the generated webhook URL from the Setup Instructions
section.
Completing the webhook configuration in Telebugs 
Navigate back to Telebugs to complete the webhook configuration:
- In Telebugs, go to Notification Configuration and select Webhooks.
- Click Create Configuration and choose Slack as the
template type.
- Enter the webhook URL from Slack into the Webhook URL field and optionally provide a name (e.g., "#errors").
- The template body will auto-fill with a Slack-compatible payload, which you can customize as needed.
- Save the configuration by clicking Save webhook.
- Test the webhook by clicking the Test button to ensure it posts to your Slack channel correctly.
- When an error occurs, Telebugs will send a notification to the specified
Slack channel using the configured webhook URL.
Here’s an example of a Slack-compatible payload:
{
  "username": "Telebugs",
  "attachments": [
    {
      "fallback": "{{project_name}}: {{trigger}} - {{error_type}}: {{error_message}}",
      "pretext": "*{{trigger}}* from <{{project_url}}|{{project_name}}>",
      "color": "#D00000",
      "fields": [
        {
          "title": "{{error_type}}{{culprit}}",
          "value": "{{error_message}}",
          "short": false
        },
        {
          "title": "Location",
          "value": "{{location}}",
          "short": false
        }
      ],
      "actions": [
        {
          "type": "button",
          "text": "View",
          "url": "{{view_url}}"
        }
      ]
    }
  ]
}
You can customize the payload however you like, using the available keys to include dynamic values from the error report (see Webhook template body placeholders). For example, you can change the color, add more fields, or modify the message format.
10.3.2 Discord 
Discord webhooks allow Telebugs to send error notifications directly to a Discord channel. This integration provides real-time alerts, enabling teams to monitor and respond to errors efficiently.
Obtain a webhook URL from Discord 
To configure a Discord webhook, follow these steps:
- In Discord, go to the server where you want to receive notifications.
- Click on the channel settings dropdown menu.
- In the Server Settings, select Integrations from the left sidebar.
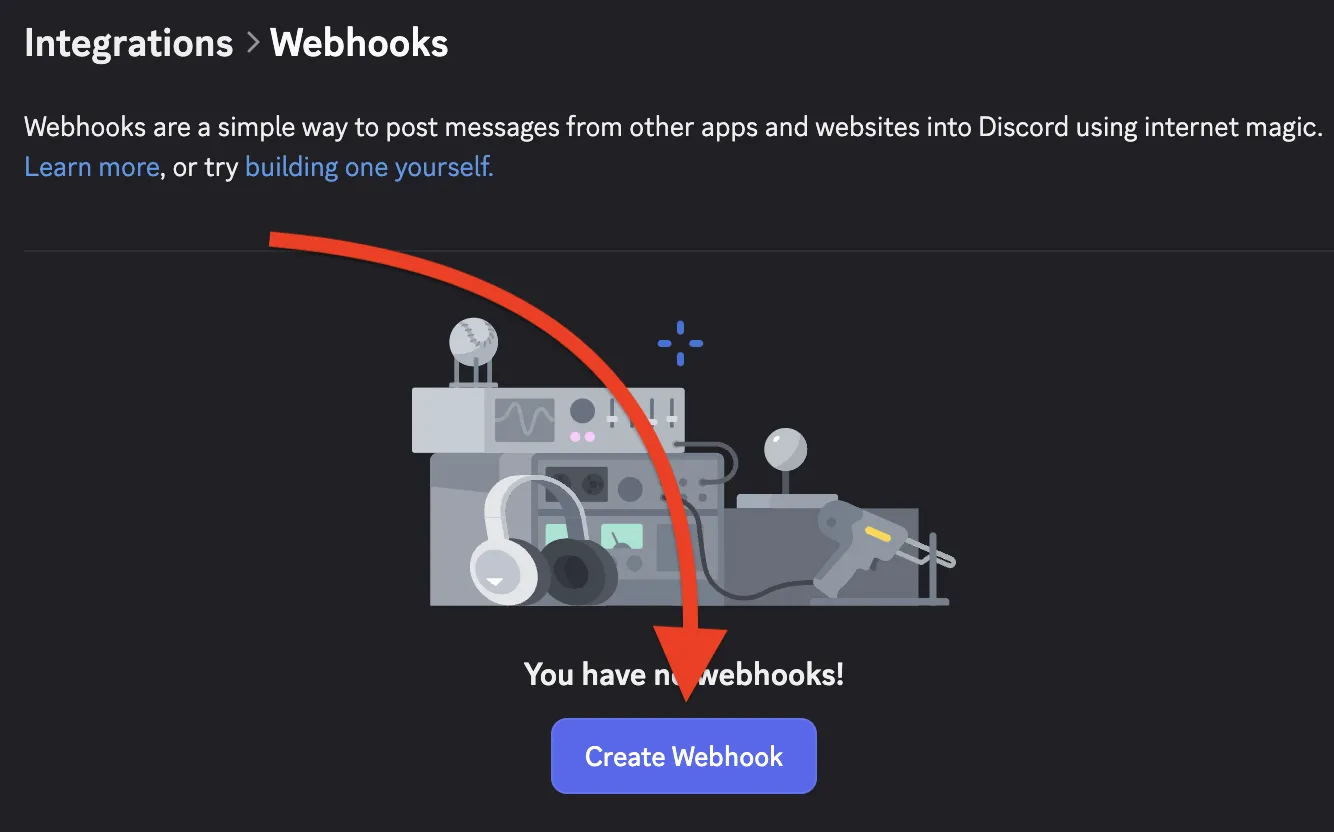
- Under "Webhooks," click Create Webhook. If no webhooks exist,
you’ll see a "You have no webhooks!" message with this option.
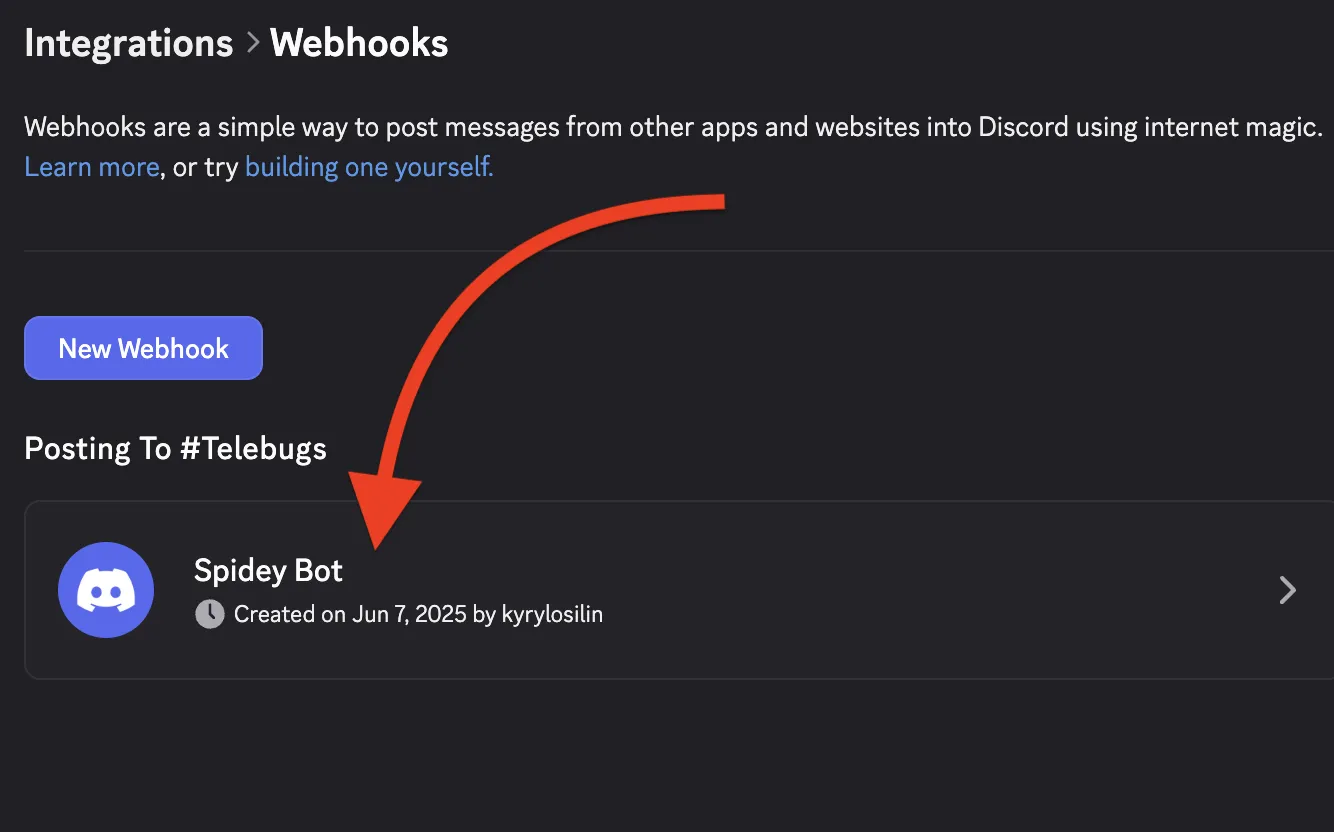
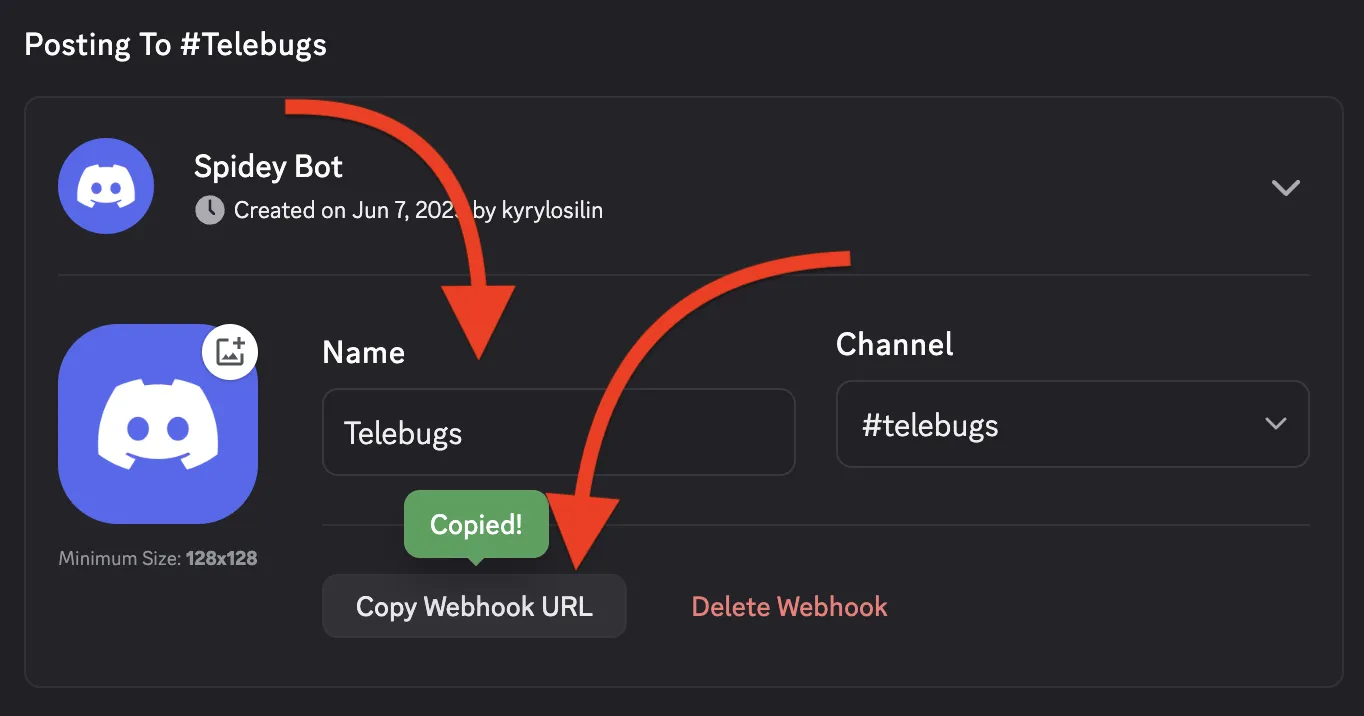
- Configure the webhook: give it a name (e.g., "Telebugs"), select the
channel where notifications will post (e.g., "#telebugs"), and optionally set an
avatar.
- Click Copy Webhook URL to copy the URL for use in Telebugs.
Completing the webhook configuration in Telebugs 
Navigate back to Telebugs to complete the webhook configuration:
- In Telebugs, go to Notification Configuration and select Webhooks.
- Click Create Configuration and choose Slack as the
template type.
- The template body will auto-fill with a Discord-compatible payload, which you can customize if needed.
- Paste the webhook URL from Discord into the Webhook URL field and optionally provide a name (e.g., "#telebugs").
- Click Save webhook to save the configuration.
- To test, click the Test button next to it. This sends a test notification to your Discord channel.
- When an error occurs, Telebugs sends a notification to the specified
Discord channel using the configured webhook URL.
Discord-compatible payload 
Here’s an example of a Discord-compatible payload:
{
  "content": "**{{trigger}}** from [{{project_name}}]({{project_url}})\n[View error]({{view_url}})",
  "embeds": [
    {
      "color": 16711680,
      "fields": [
        {
          "name": "{{error_type}}{{culprit}}",
          "value": "{{error_message}}"
        },
        {
          "name": "Location",
          "value": "{{location}}"
        }
      ]
    }
  ]
}
You can customize the payload however you like, using the available keys to include dynamic values from the error report (see Webhook template body placeholders). For example, you can change the color, add more fields, or modify the message format.
10.3.3 Custom webhooks 
Custom webhooks in Telebugs allow you to integrate with any external service that accepts HTTP POST requests. This flexibility enables you to send error notifications to various platforms, such as custom logging systems, incident management tools, or any other service that can process JSON payloads. By using custom webhooks, you can tailor the notification format and content to meet your specific requirements. To configure a custom webhook, follow these steps:
- In Telebugs, navigate to Notification Configuration and select Webhooks from the sidebar.
- Click Create Configuration to add a new webhook.
- In the Add a new webhook form, select Custom as the template type from the dropdown.
- Enter the URL of your custom endpoint in the Webhook URL field. This URL must be publicly accessible and capable of handling POST requests.
- Optionally, provide a name for the webhook in the Name field to identify it later (e.g., "Custom Logging System").
- Manually define the JSON payload in the Template body field. Use
placeholders like
{{key}}to insert dynamic values from the error report. Refer to the Webhook template body placeholders section for a list of available keys. - Save the configuration by clicking Save webhook.
- Test the webhook by clicking the Test button next to it in the Configured webhooks section to ensure it sends the payload correctly to your custom endpoint.
Example custom payload 
Below is an example of a custom JSON payload that you can use as a starting point:
{
  "project_name": "{{project_name}}",
  "trigger": "{{trigger}}",
  "subject": "{{subject}}",
  "culprit": "{{culprit}}",
  "location": "{{location}}",
  "error_type": "{{error_type}}",
  "error_message": "{{error_message}}",
  "view_url": "{{view_url}}"
}
This payload includes key details about the error, such as the project name, trigger event, error type, and a link to the error report. You can customize this structure by adding or removing fields, modifying the keys, or formatting the data to suit your service’s requirements. For instance, you might add a timestamp or reformat the message for better readability. Note: Ensure that your custom endpoint is configured to accept POST requests and can process the JSON payload correctly. After saving the webhook, use the Test button to verify that the notification is sent and received as expected. This step is crucial to confirm the integration works before relying on it for real error notifications.
11 Projects 
Projects are the beating heart of Telebugs — your dedicated workspaces for tracking, analyzing, and conquering errors in specific apps or services. Whether you’re monitoring a single side project or juggling multiple enterprise apps, each project keeps things organized with its own error reports, settings, and team access. Think of them as isolated bug-hunting arenas. In this chapter, we’ll explore how to view your projects, dive into individual dashboards, and customize settings to fit your workflow. Let’s jump in!
- Project overview
- Individual project view
- Pinning and unpinning a project
- Project settings
- General settings
- Token settings
- Access control
- Notifications settings
- Danger zone
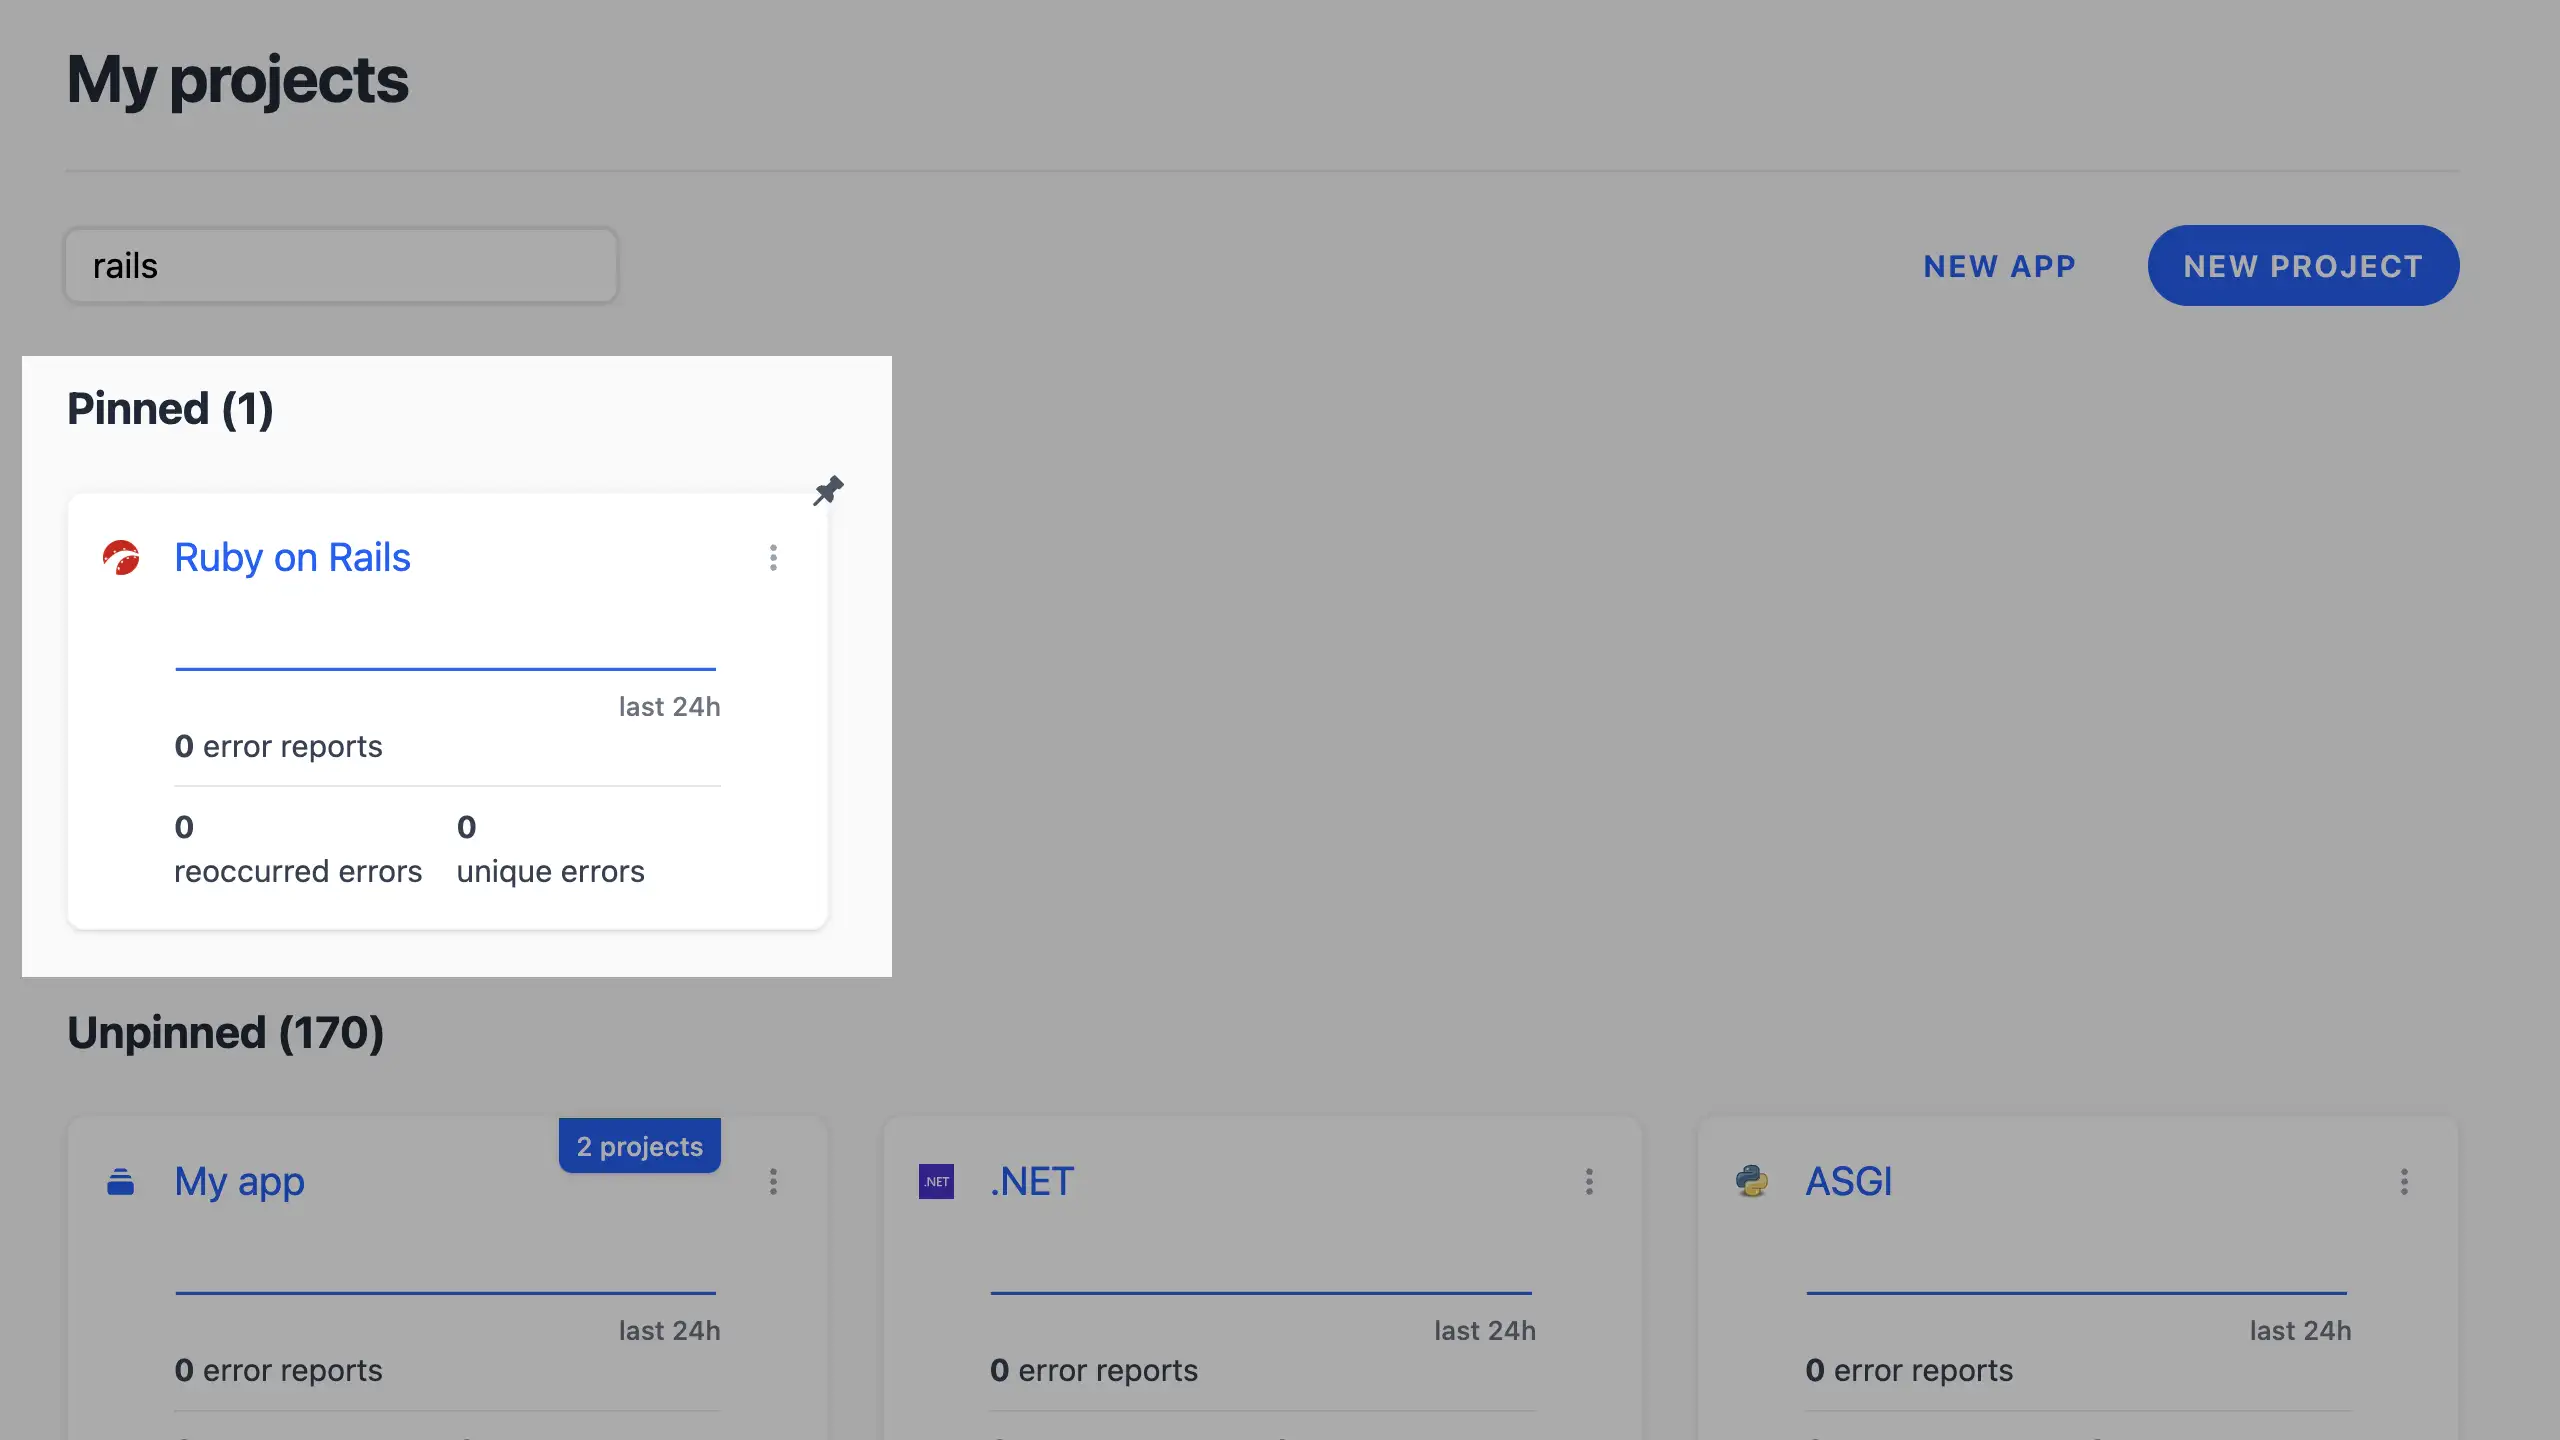
11.1 Project overview 
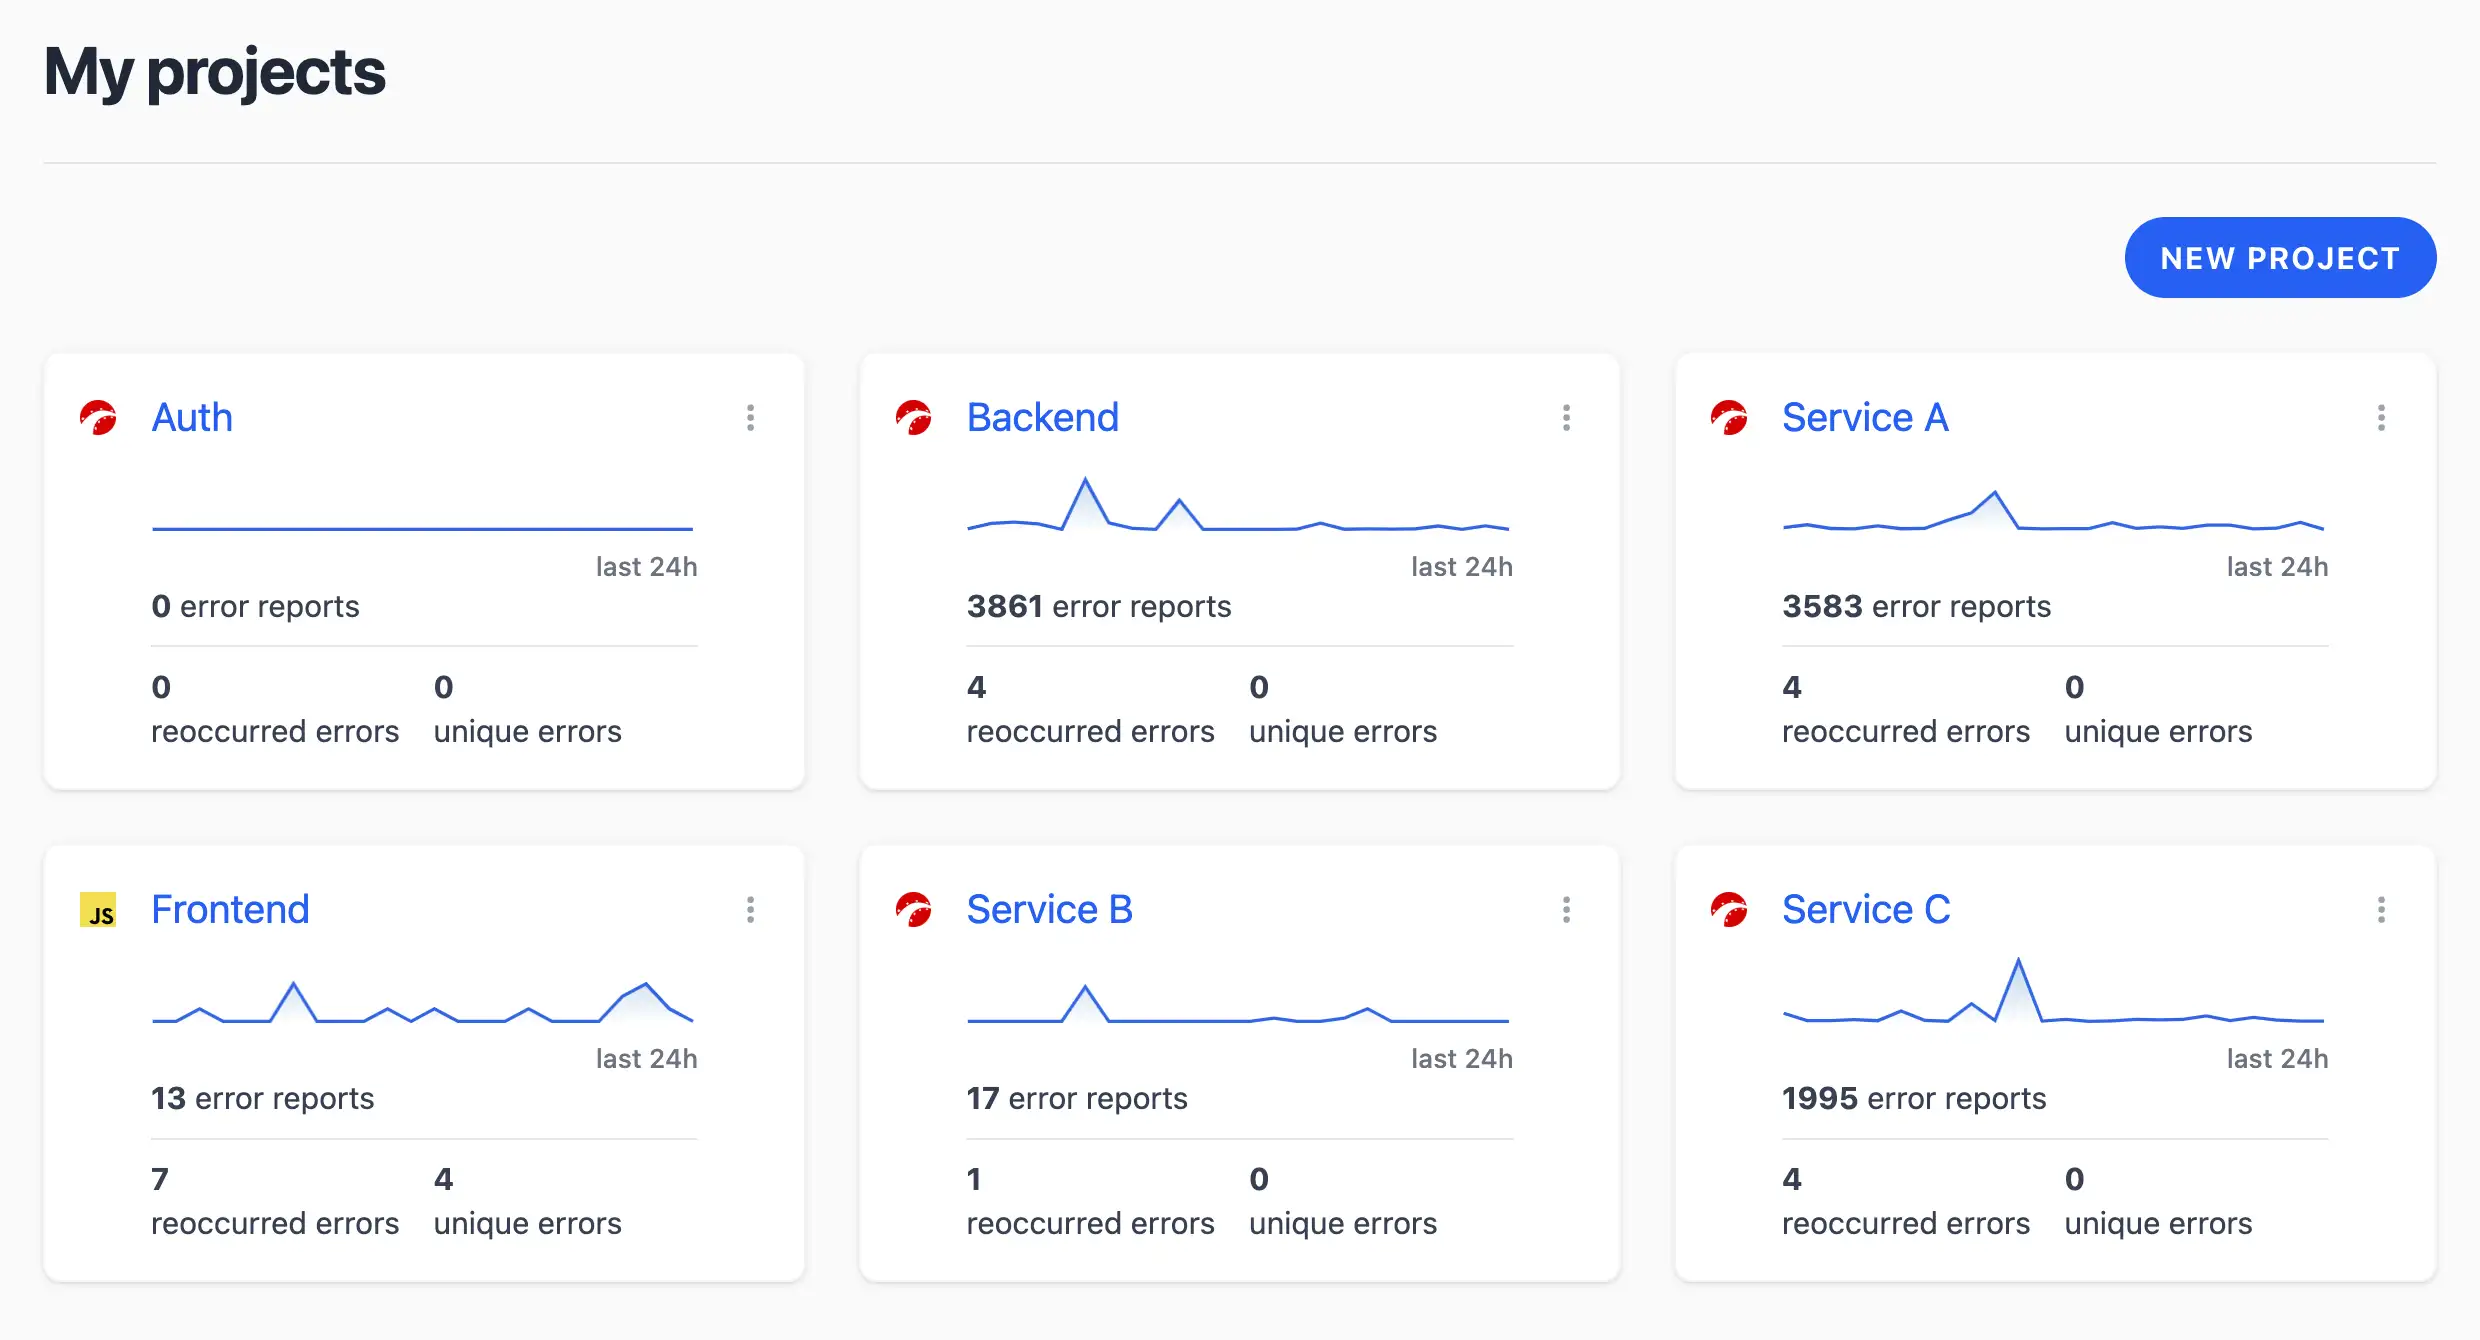
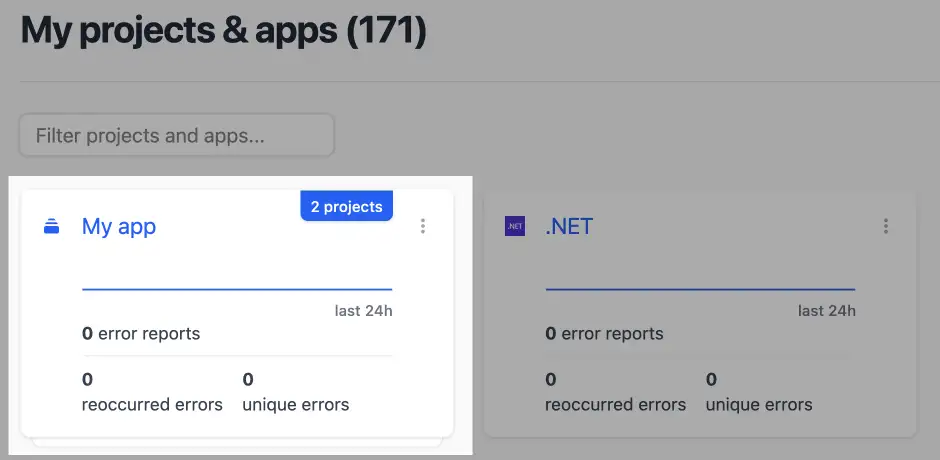
Your projects live in a clean, glanceable index view — perfect for getting the big picture. Head to the main dashboard (or click "Projects" in the nav) to see them all laid out in a responsive grid. Each project card packs a punch:
- Platform icon: A quick visual cue for the tech stack (e.g., Ruby on Rails, PHP, JavaScript).
- Project name: Click to enter the project’s error dashboard.
- Sparkline chart: A mini-graph showing recent error trends (24h).
- Dropdown menu: Tap the three dots for quick actions like editing settings.
If you’re flying solo with one project, this view keeps it simple. Got a fleet? The grid scales beautifully on desktop or mobile.
Pro tip: Use the "New Project" button at the top-right to spin up more — Telebugs makes it effortless to segment your monitoring.
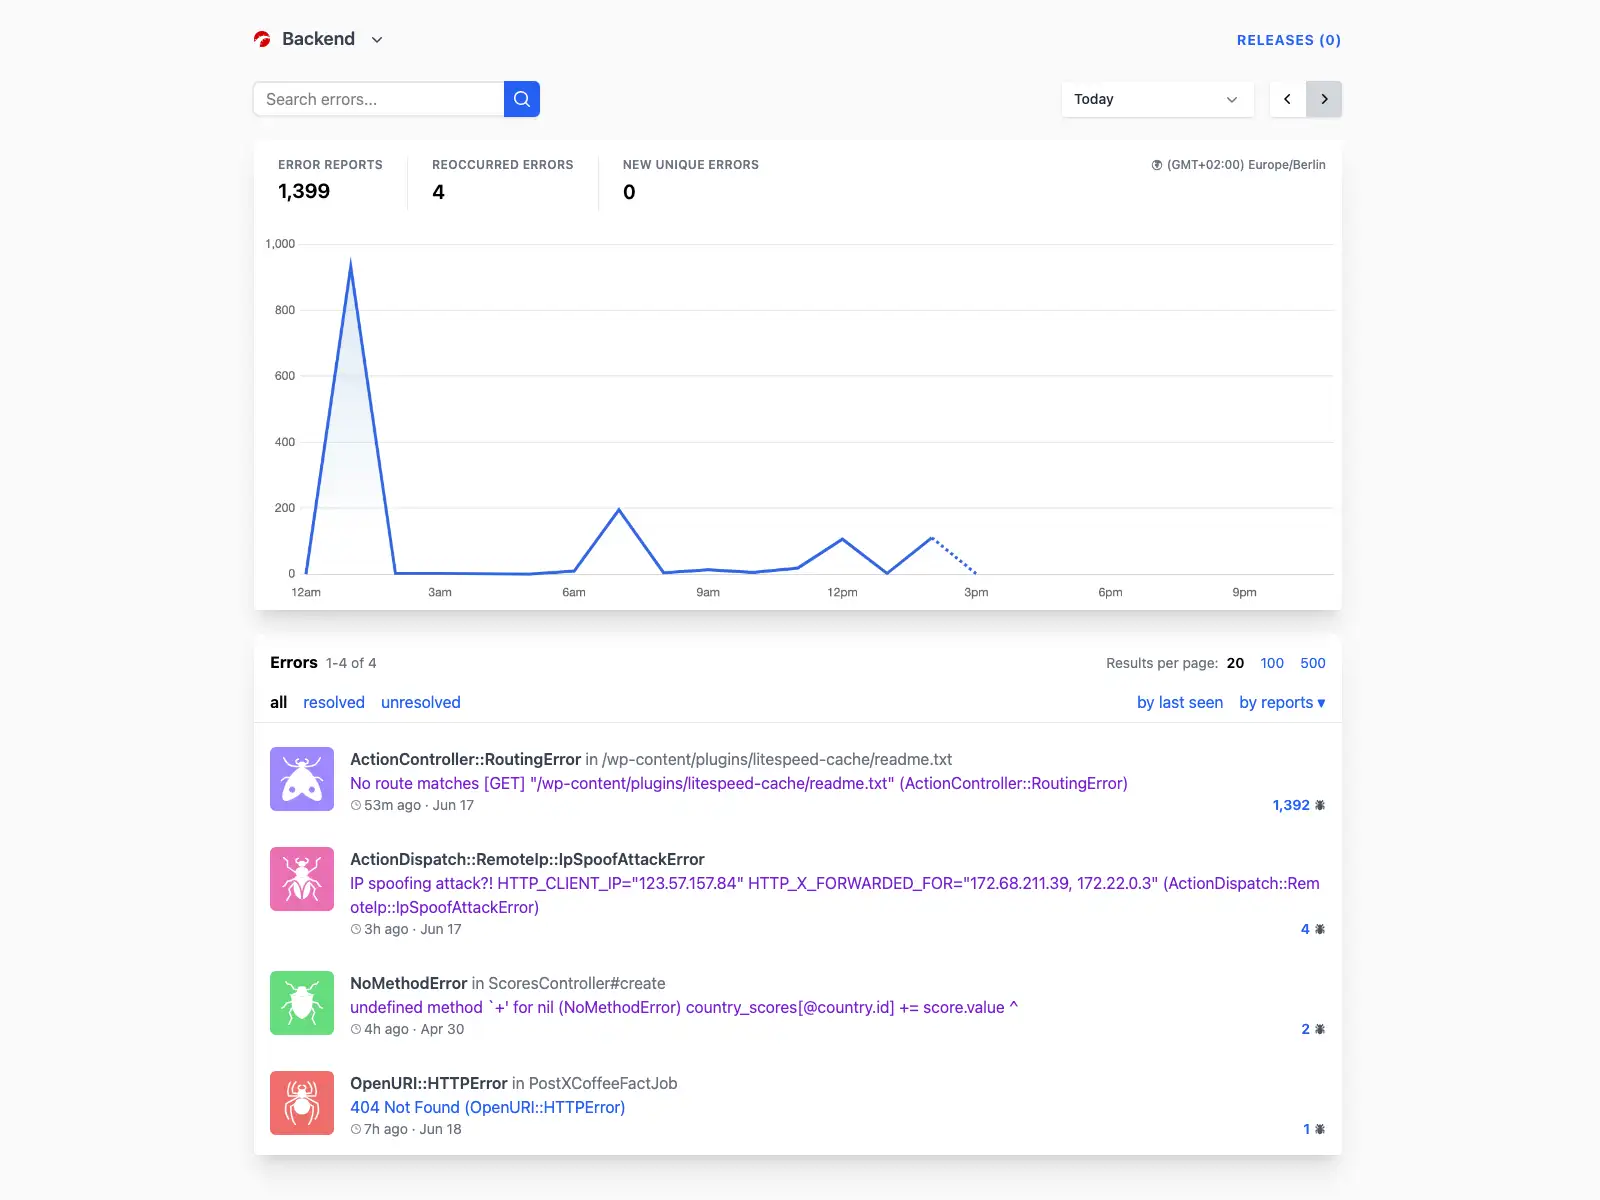
11.2 Individual project view 
Click into a project, and you’re in the command center: a dynamic dashboard tailored for deep dives into your errors. This is where the real action happens — spotting patterns, resolving issues, and keeping your app humming.
Key features at a glance:
- Project picker: Dropdown in the top-left to switch projects or jump to settings. Super handy for multi-project users.
- Releases link: Quick access to your project’s release history.
- Search bar: Hunt for specific errors by message, type, or details. Results update live as you type.
- Date range selector: Filter errors by time (today, last week, etc.) with a pager for navigation.
- Stats overview: At-a-glance metrics like total reports, reoccurred vs. new errors.
- Interactive chart: Visualizes error volume over time — zoom in on spikes for clues.
- Error list: Each unique error is grouped, showing type, message, timestamp, and report count. Click for details.
- Filters: Toggle between all, resolved, or unresolved errors; sort by last seen or count.
If your project is error-free (lucky you!), you’ll see SDK setup instructions instead. Once reports flow in, the dashboard auto-refreshes with real data — no manual reloads needed.
Quick tip: Use the search and filters to triage fast — focus on unresolved high-volume errors first. The chart is your trend-spotter; watch for patterns tied to deploys or traffic surges.
11.3 Pinning and unpinning a project 
Pinning a project keeps it at the top of the projects dashboard for quick access, whether it’s standalone or part of an app. To pin or unpin:
- In the projects dashboard, click the three dots on the project card.
- Select Pin project to pin it or Unpin project to remove the pin.
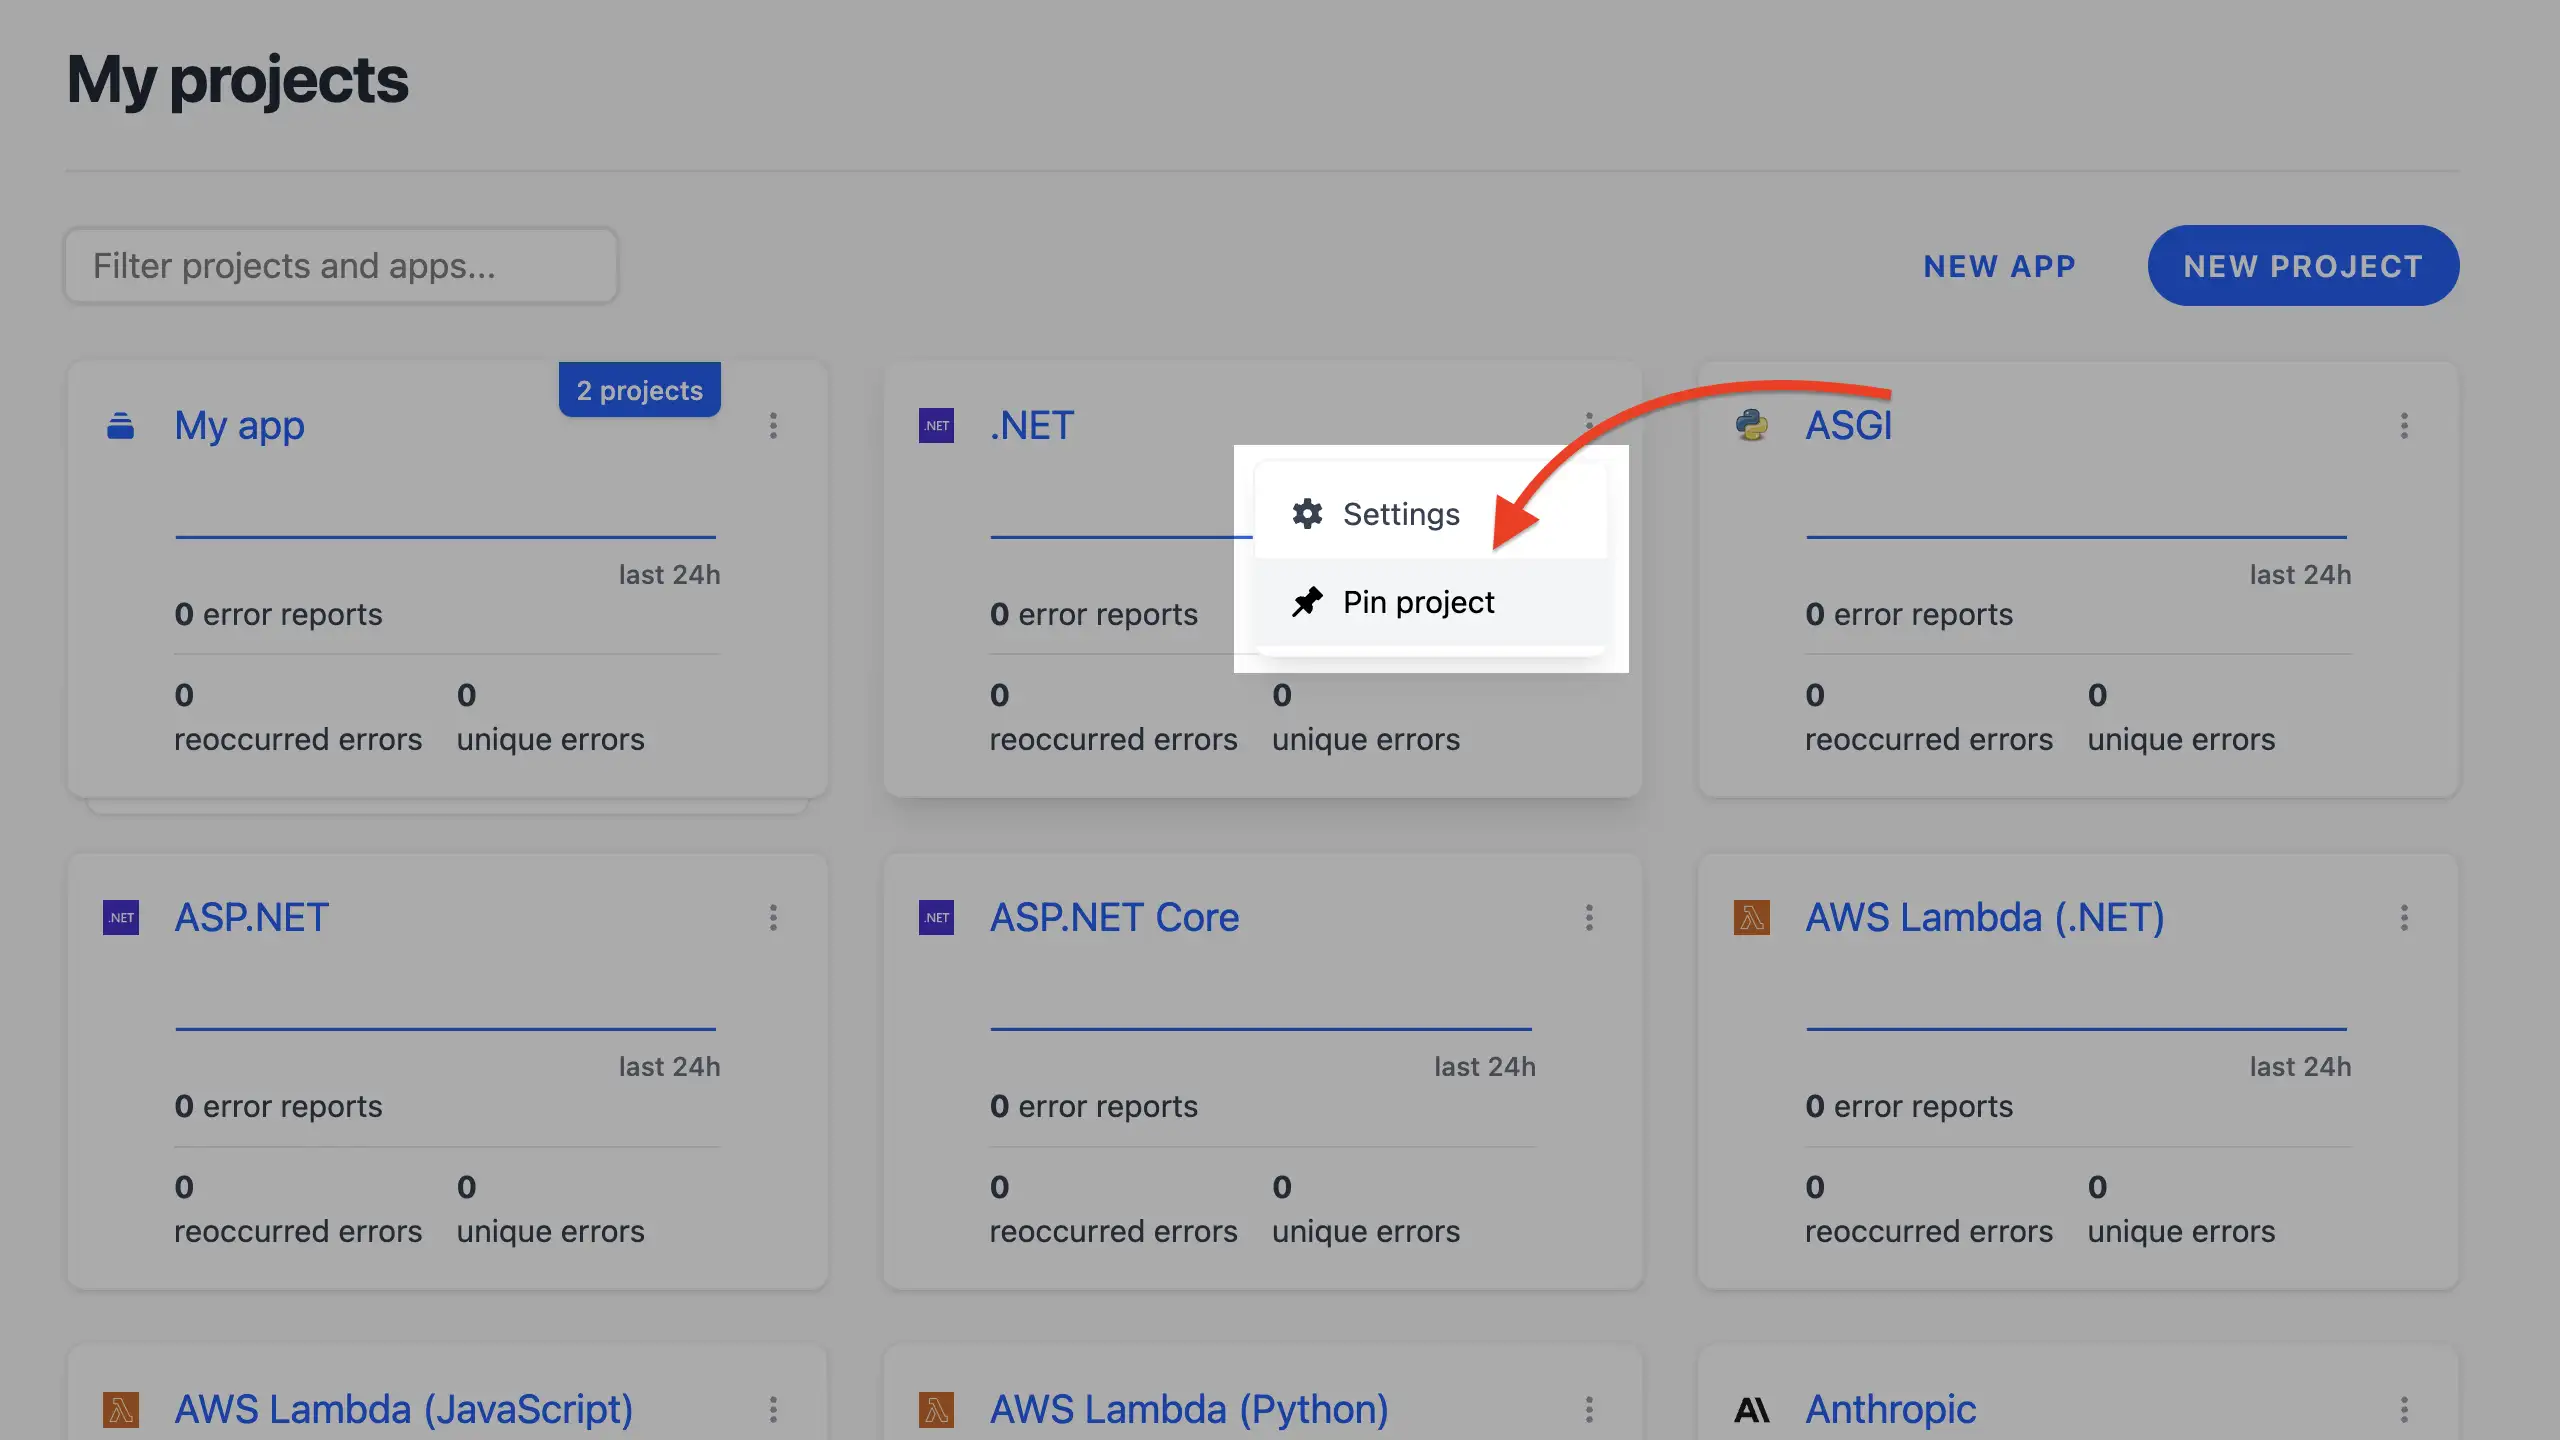
- Pinned projects display a pin icon and remain at the top of the grid, even within an app’s project list.
Notes 
- Pinning a project is independent of app pinning. A pinned project stays at the top of the projects dashboard or within its app’s project list.
- Multiple projects can be pinned, and they will be ordered by their pinned position in the grid.
Pro tip: Pin projects you frequently monitor to streamline your workflow, especially for critical services or those with active issues.
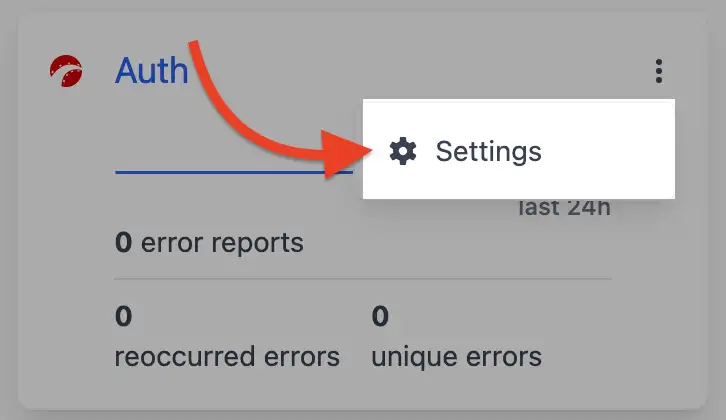
11.4 Project settings 
Welcome to the nerve center of your Telebugs project! Project settings are where you fine-tune how Telebugs works for you, from basic details like names and timezones to security tokens, team access, notifications, and even those high-stakes "danger zone" actions. Think of this as your project’s control panel: customize it wisely to keep everything running smoothly.
To get started, go to your project dashboard, click the three dots on the project card, and select Settings:
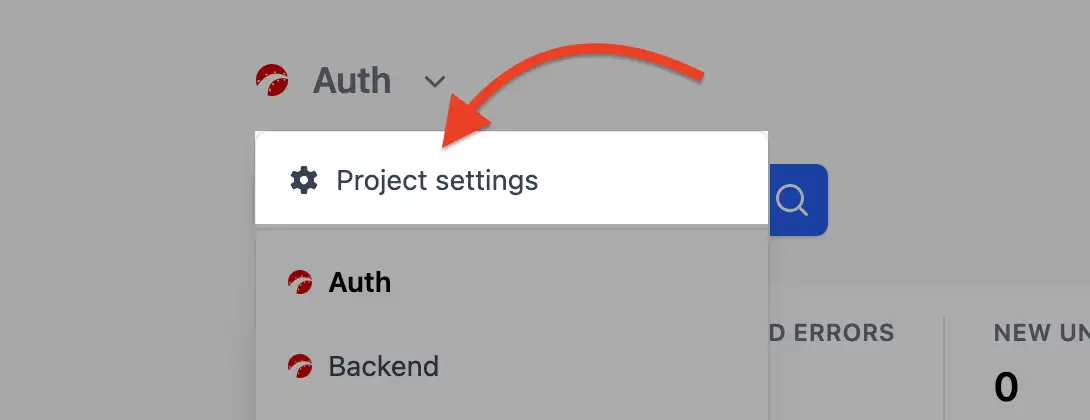
If you’re inside a project, click the project name in the top-left corner and select Project Settings from the dropdown menu.
In this guide, I’ll walk you through each tab in the project settings, explaining what you can do and why it matters. Whether you’re a project owner or an admin, these settings help you tailor Telebugs to your team’s needs.
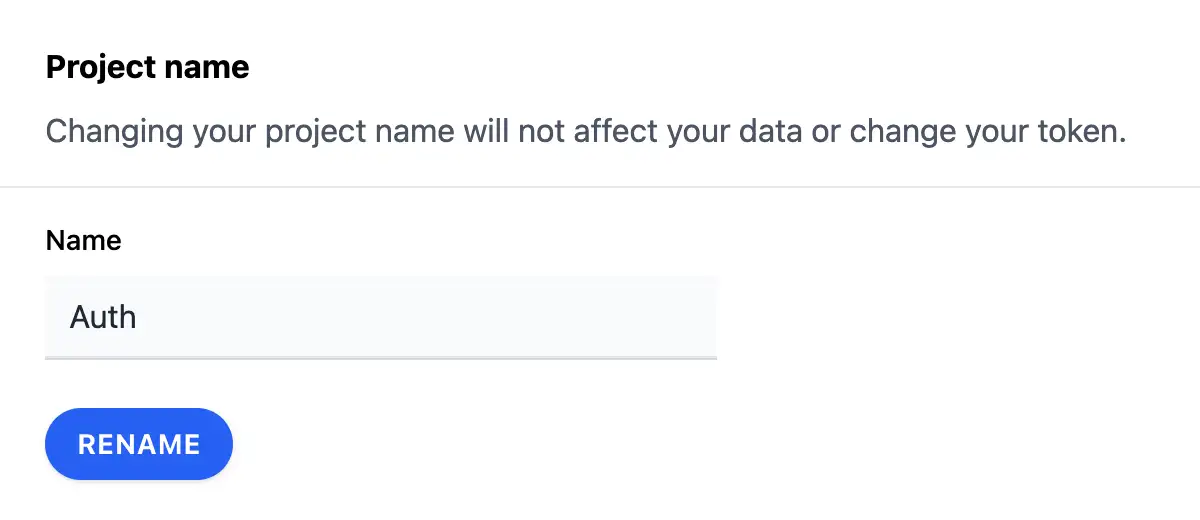
11.5 General settings 
Start here to set the foundation. The General tab is all about the basics that make your project feel like home. Updating these won’t mess with your data — it’s purely for clarity and convenience.
- Project name: Give your project a memorable name, like "AwesomeApp
Backend" instead of a generic one. This helps when you have multiple projects.
Just type in the new name and hit "Rename." Pro tip: Keep it descriptive so your
team knows at a glance what it’s for.
- Project timezone: Errors don’t respect time zones, but your team does!
Set this to match where most of your users or developers are. It affects how
dates and times appear in reports (e.g., "today’s errors"). Search or select
from the dropdown, then click "Change timezone." If you’re global, consider UTC
for neutrality.
- Project platform: This picks the right icon and tailors SDK setup
guides to your tech stack (e.g., Ruby, JavaScript). It’s cosmetic but super
helpful for quick reference. Choose from the list and save — your installation
instructions will update automatically.
These tweaks make your dashboard more intuitive. For example, if you’re debugging late-night issues, the right timezone can save you from mental math headaches!
11.6 Token settings 
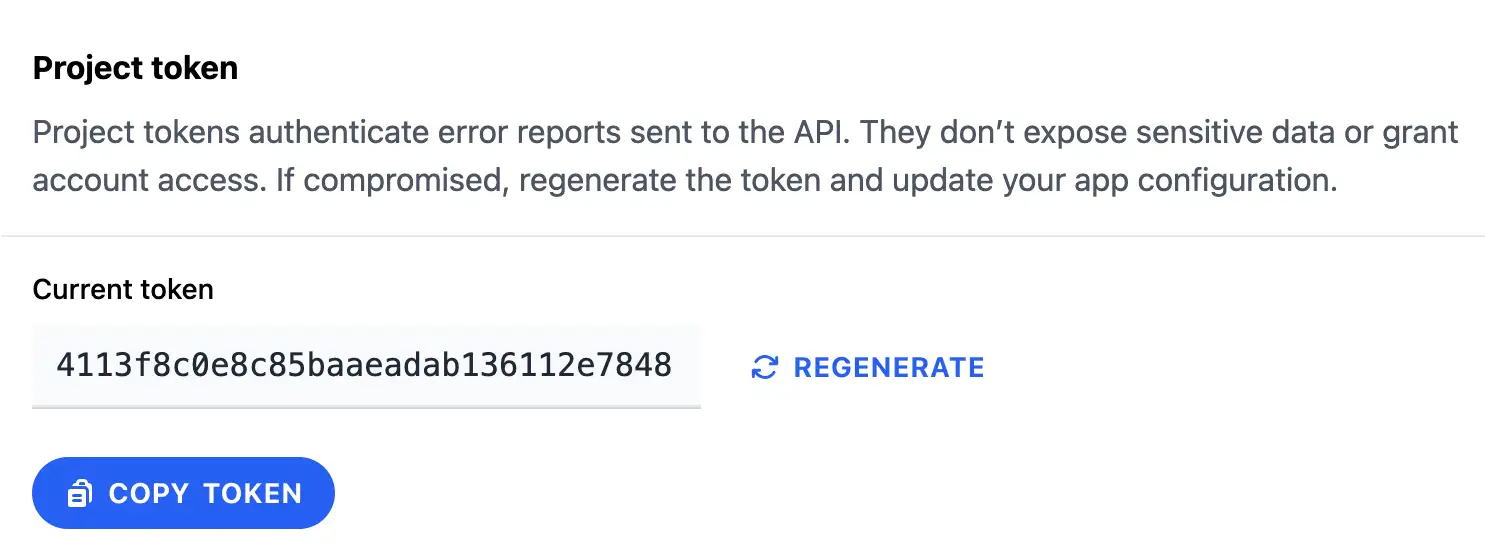
Security first! Tokens are the keys to your project’s door — they let your app send error reports without exposing everything. If something feels off (like unexpected reports), regenerate and update your code pronto.
- Project token: This is the secret code your SDK uses. View it
here, copy it for setup, or regenerate if compromised (old one stops working
immediately). Always store it securely in environment variables, not hardcoded.
- Data Source Name (DSN): The full URL for sending errors (includes your
token). Share sparingly — it’s like a mailing address with a key attached. Copy
it directly into your SDK config.
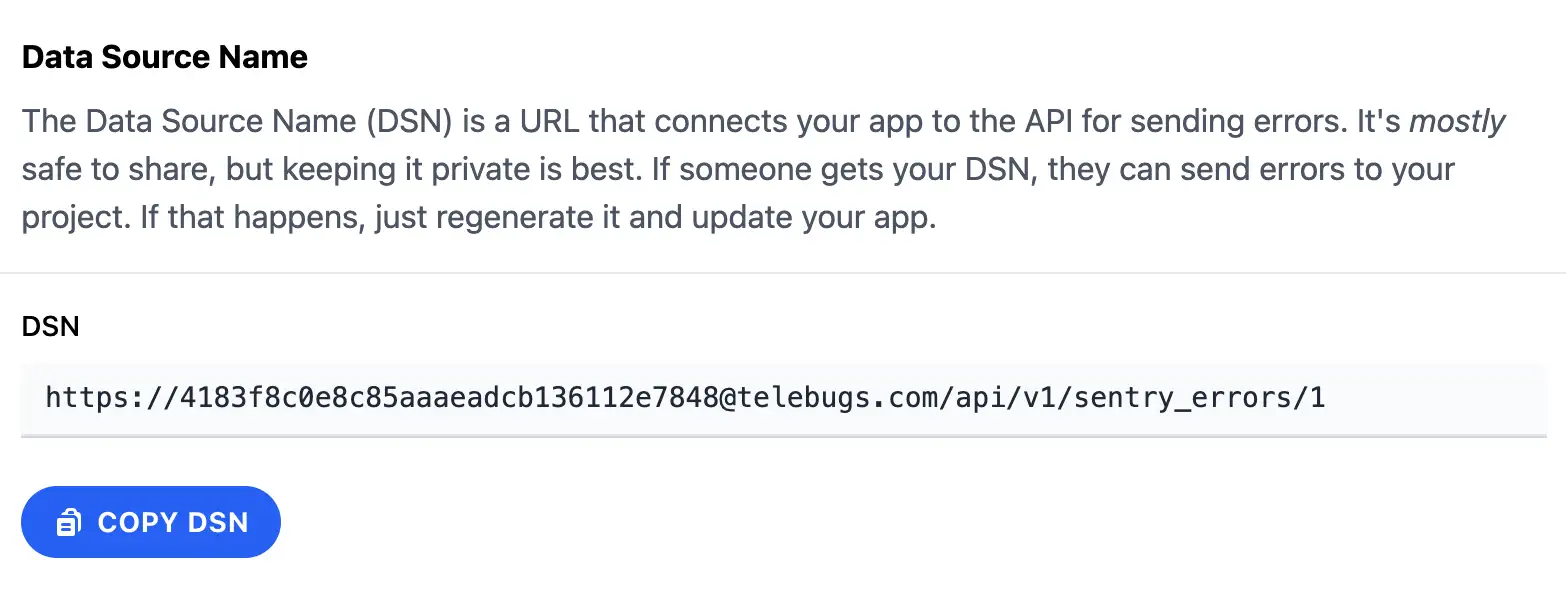
Quick guide: After regenerating, test your setup by triggering a sample error. No reports? Double-check the new token in your app.
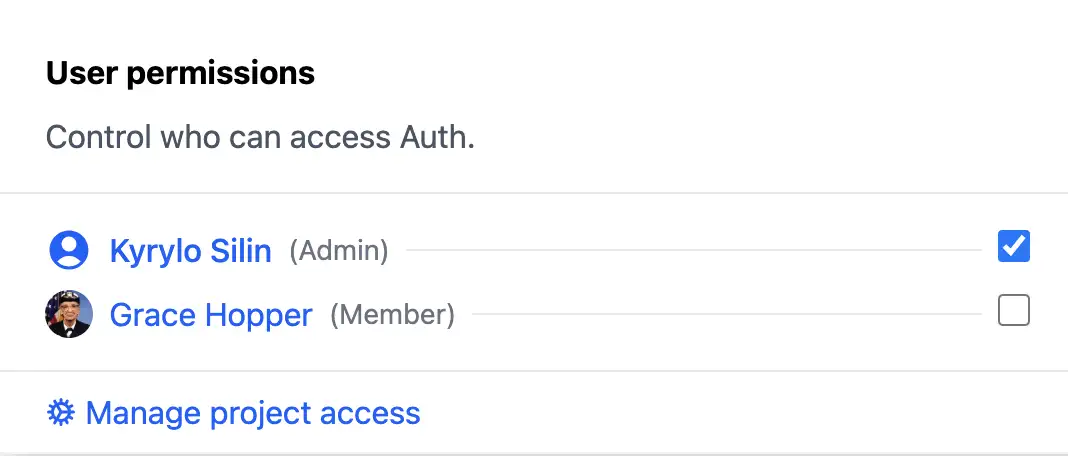
11.7 Access control 
Collaboration is key, but so is control. This tab lets you decide who sees what in your project. It’s perfect for teams where not everyone needs full access.
View your team list and toggle checkboxes to grant or revoke project access. Admins can do everything; members can view reports but not change settings.
Step-by-step:
- Spot a user in the list.
- Check the box to add them (or uncheck to remove).
- Changes save automatically — notify them if needed.
For broader team management, jump to Team management to handle roles and invites. This keeps sensitive projects locked down while fostering teamwork.
11.8 Notifications settings 
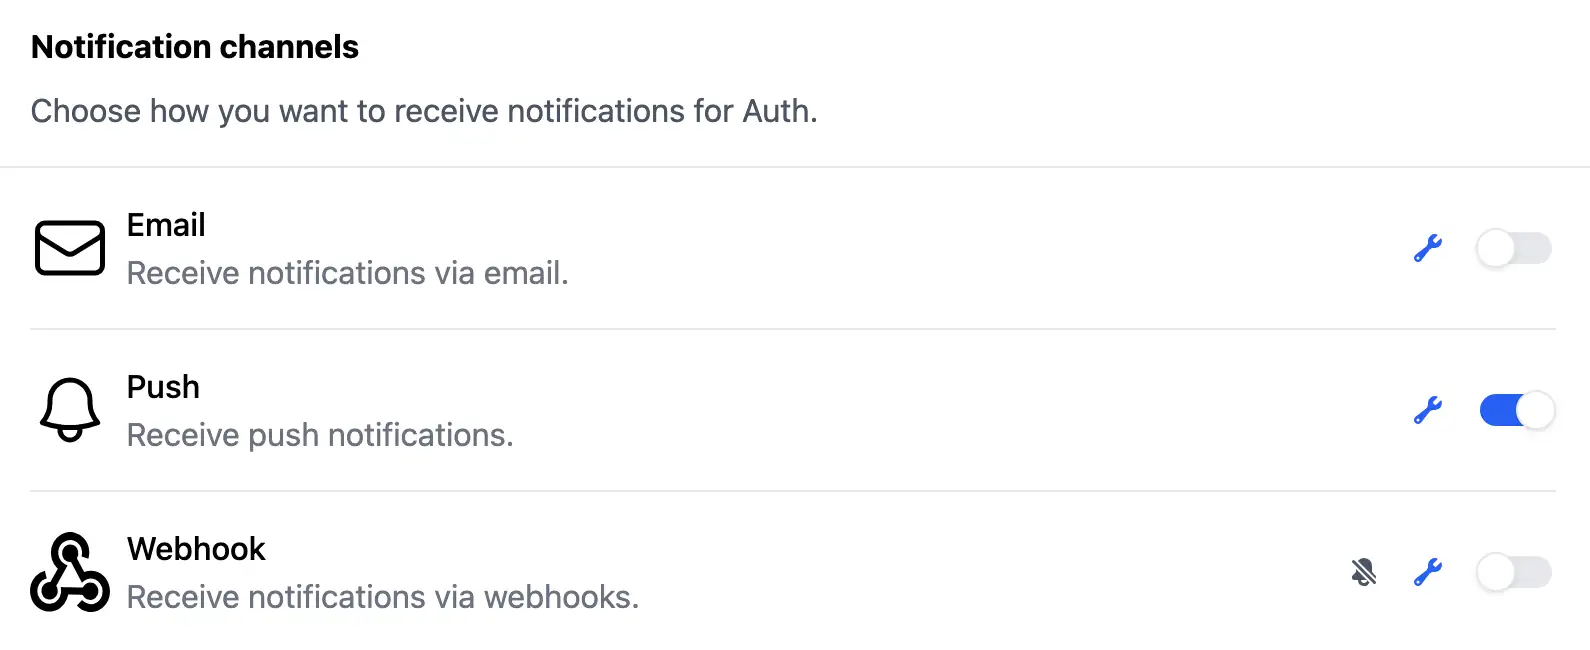
Stay in the loop without the noise. Notifications ensure you’re alerted to issues that matter, via your preferred channels.
- Notification channels: Pick from Email, Push, or Webhook. Enable one
(toggle on), configure if needed (e.g., webhook URL), and test. Start with
Push — it’s straightforward.
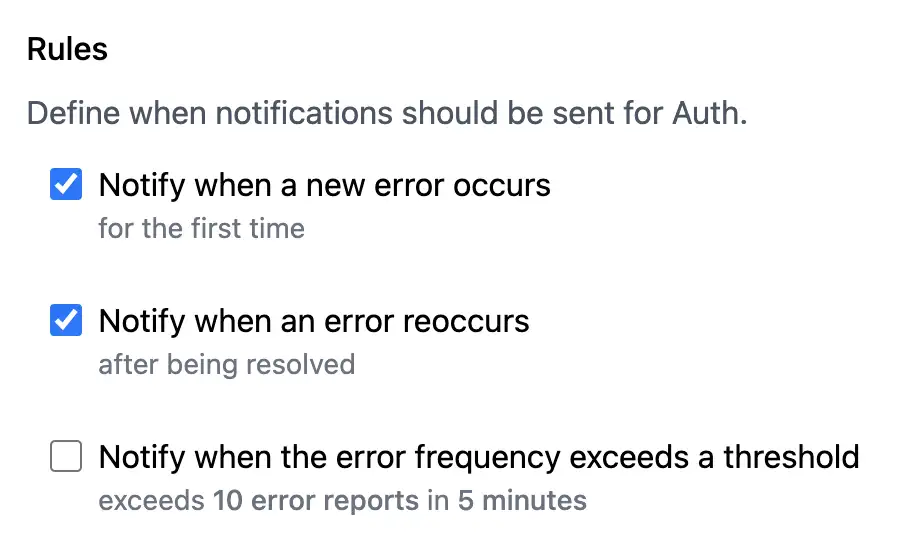
- Rules: Set conditions like "notify on new errors" or "high-severity
only." Rules activate once a channel is on. Experiment: Create a rule for
critical errors to ping your team instantly.
- Recipients: Choose who gets pinged. Toggle per user — great for on-call
rotations.
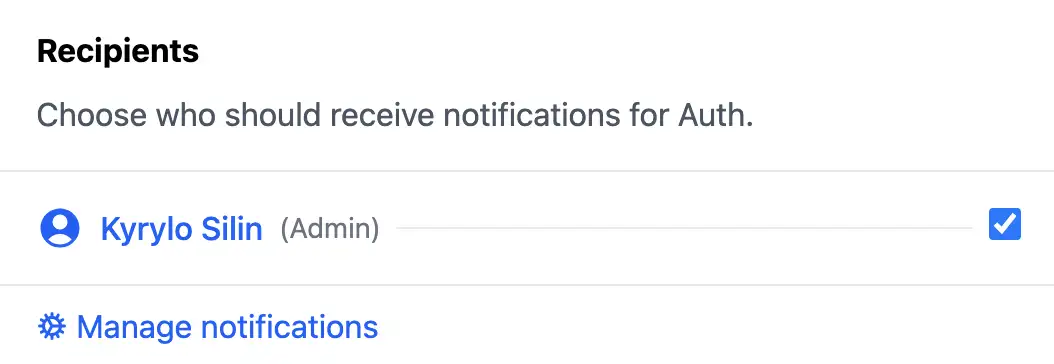
Pro tip: Combine channels for redundancy (email + push). Test by simulating an error and checking if alerts fire. Fine-tune to avoid alert fatigue!
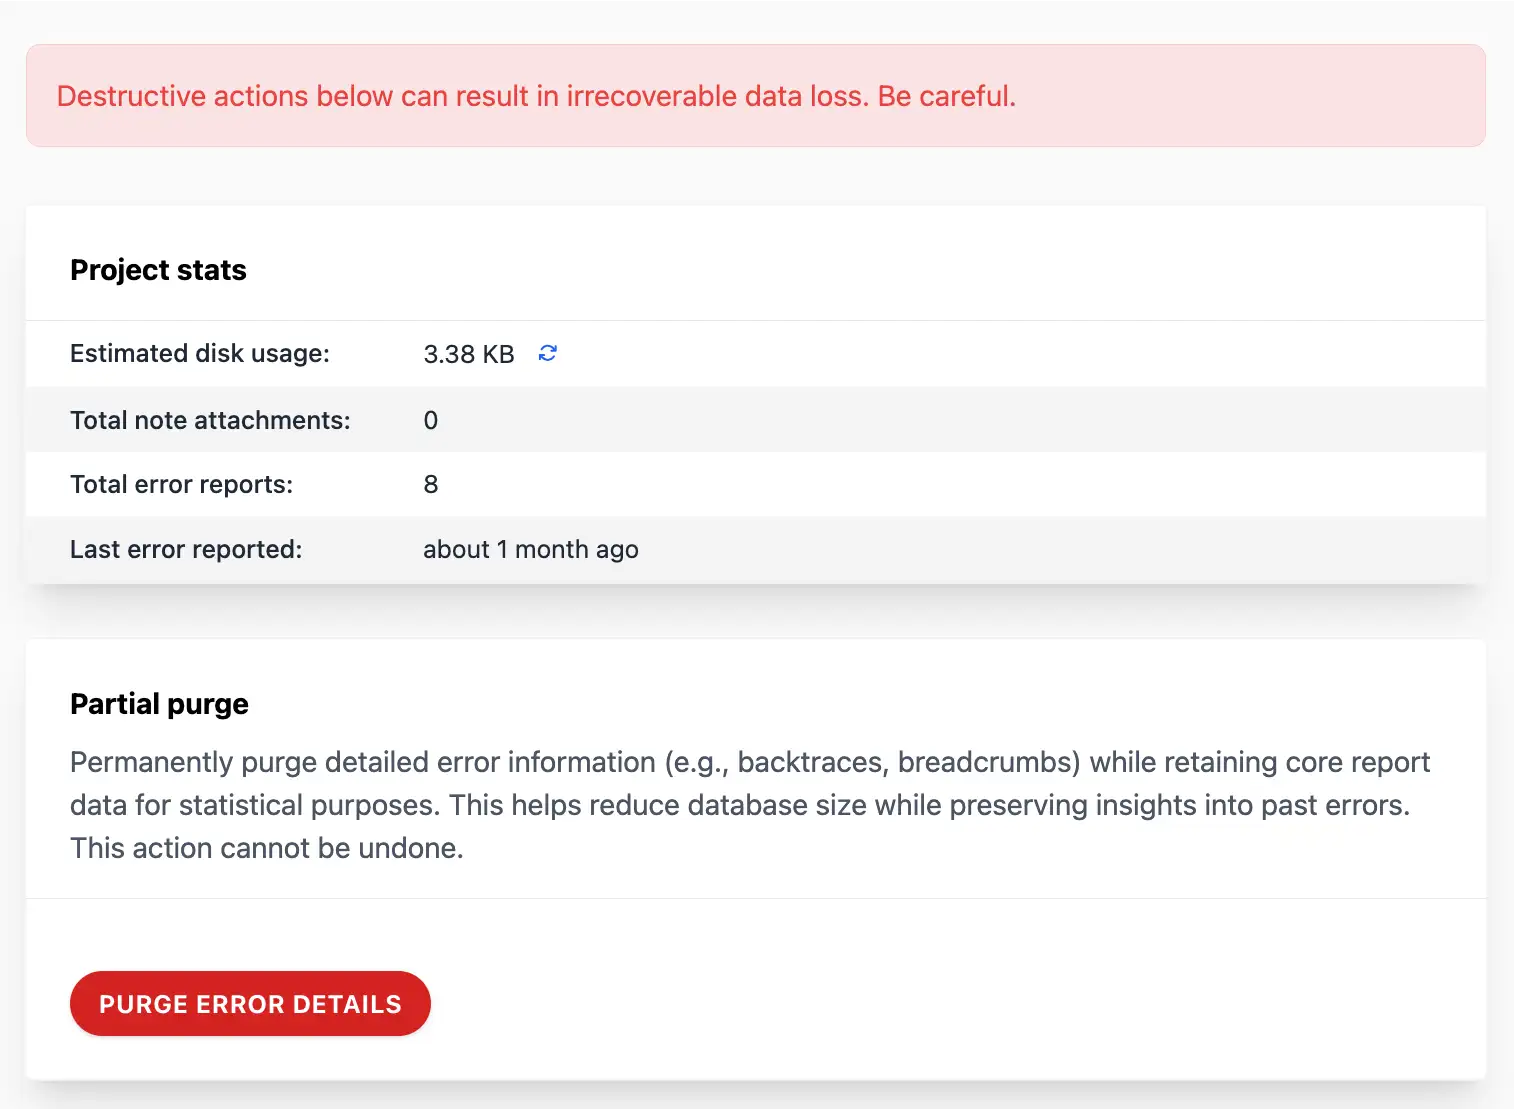
11.9 Danger zone 
Proceed with caution — this is where irreversible actions live. Use these for cleanup or resets, but always back up if possible.
- Project stats: Quick overview of usage (disk space, reports). Refresh for latest — handy before purging to gauge impact.
- Partial purge: Strip details from old reports but keep stats. Ideal for slimming down without losing history insights.
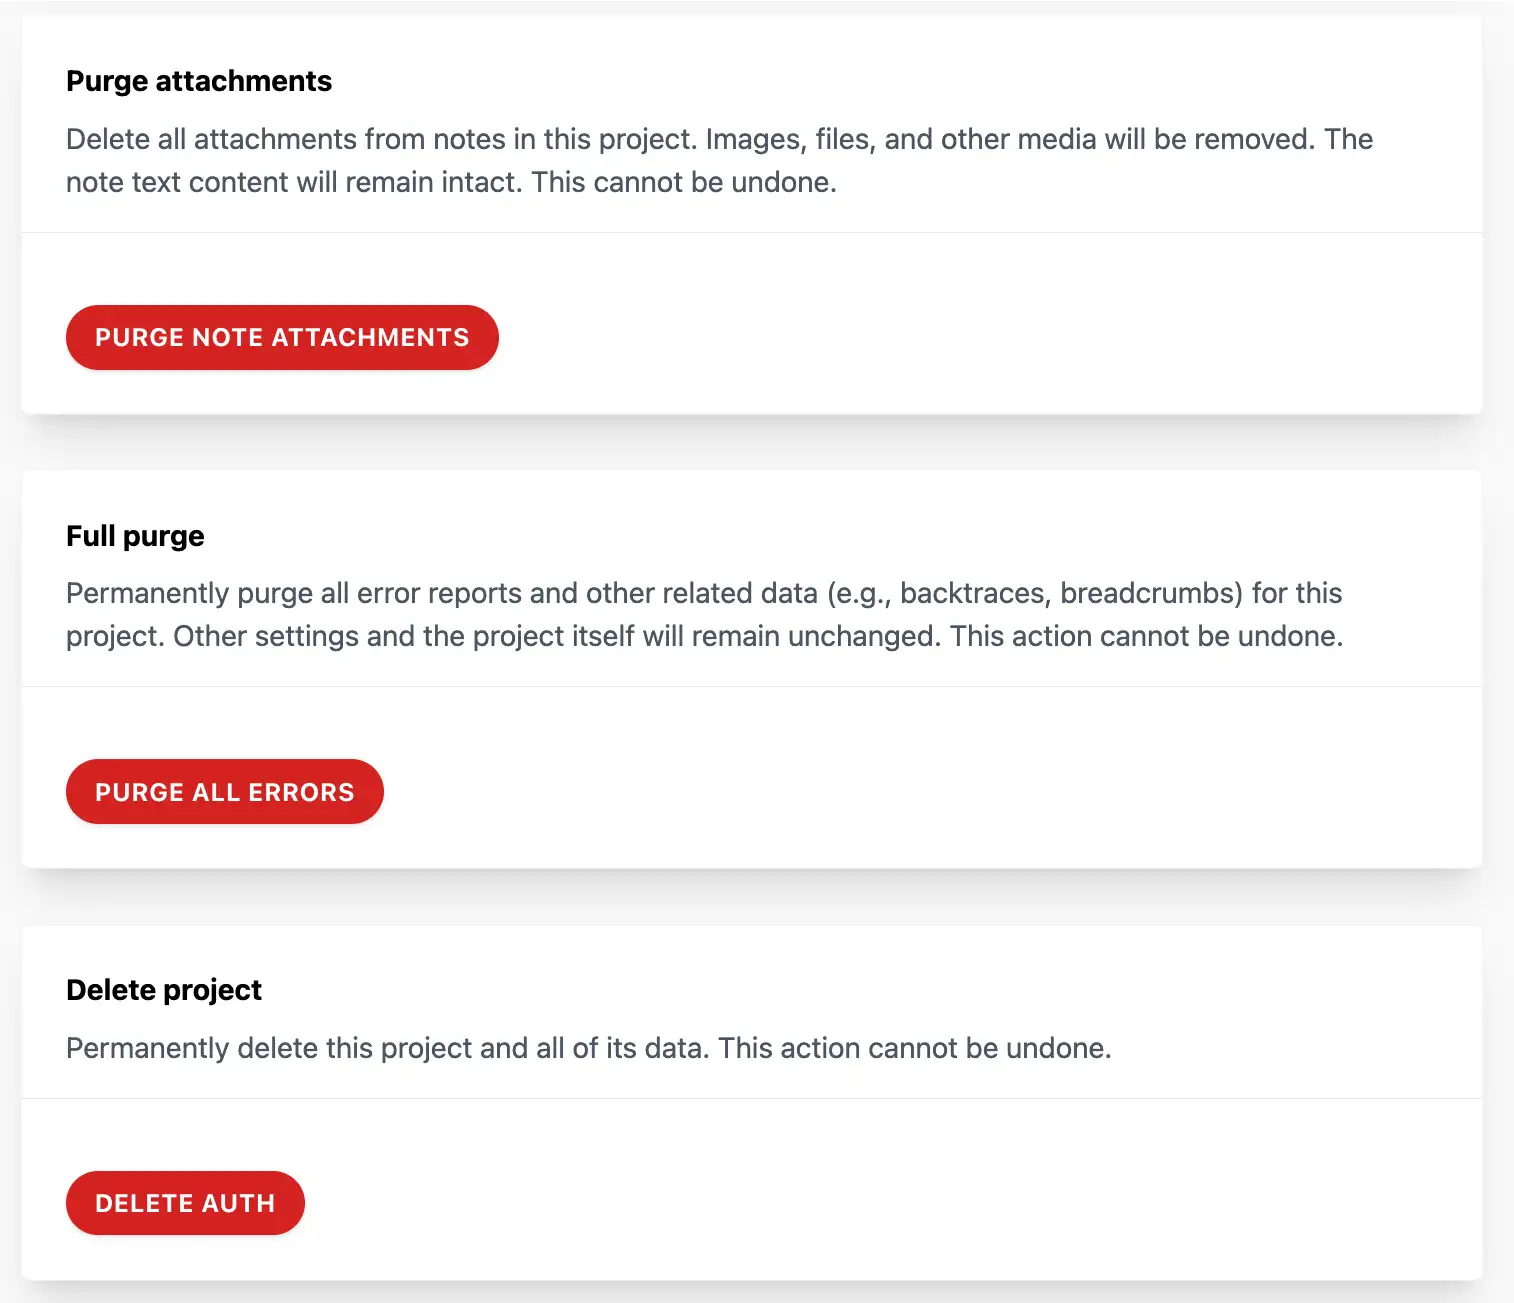
- Purge attachments: Clear out files from notes. Text stays; media goes. Useful if storage is ballooning.
- Full purge: Wipe all error data clean. Project shell remains for fresh starts.
- Delete project: Nuke everything. Confirm twice — once gone, it’s gone forever.
Before clicking, ask: "Do I need this data?" For audits, export first. These tools keep your instance lean, but wield them wisely!
12 Apps 
Apps let you organize your projects and group them together for easier discovery and management. This feature is especially useful for teams with multiple projects, as it allows you to create logical groupings based on shared characteristics like language, framework, or purpose.
For example, for web applications, you might create an app for all your frontend projects and another for backend projects. This way, you can quickly navigate between related projects without cluttering your project list.
12.1 Creating an app 
To create a new app, follow these steps:
- Navigate to the main dashboard where all your projects are listed.
- Click the New App button to open the app creation form.
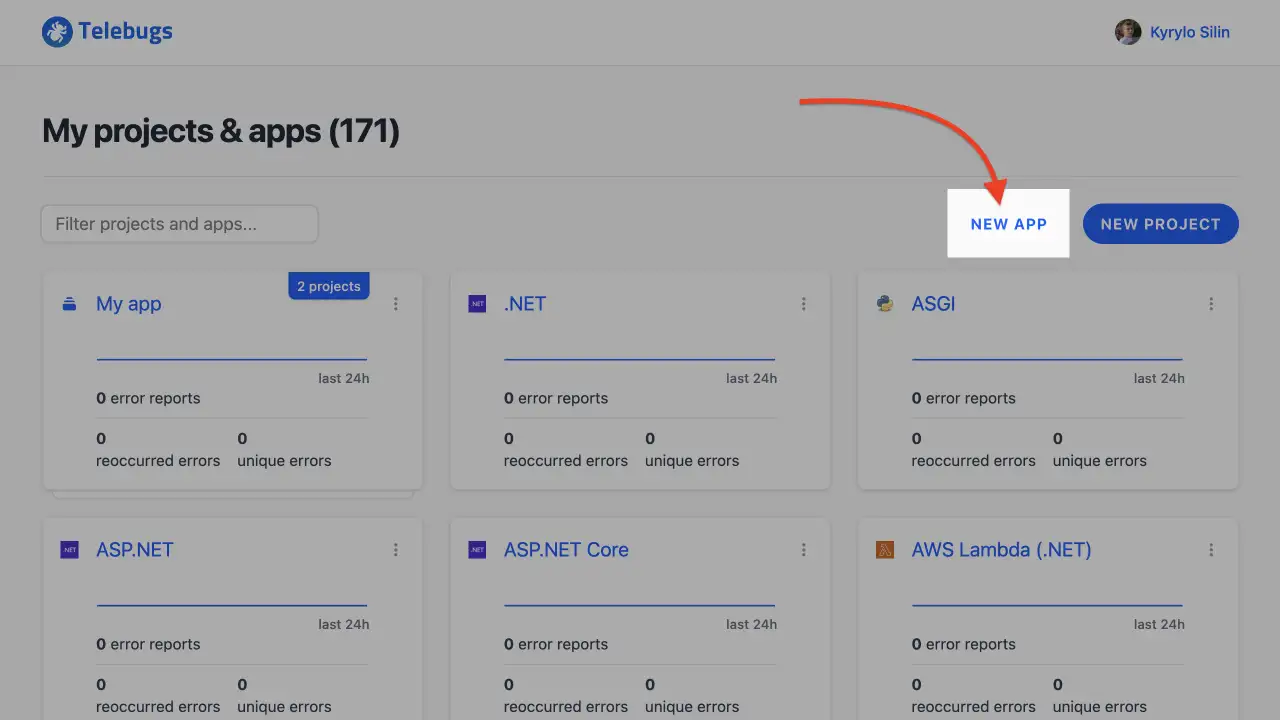
- In the App name field, enter a descriptive name for your app (e.g., "Frontend Suite" or "Backend Services"). This name should reflect the app’s purpose or the projects it will contain.
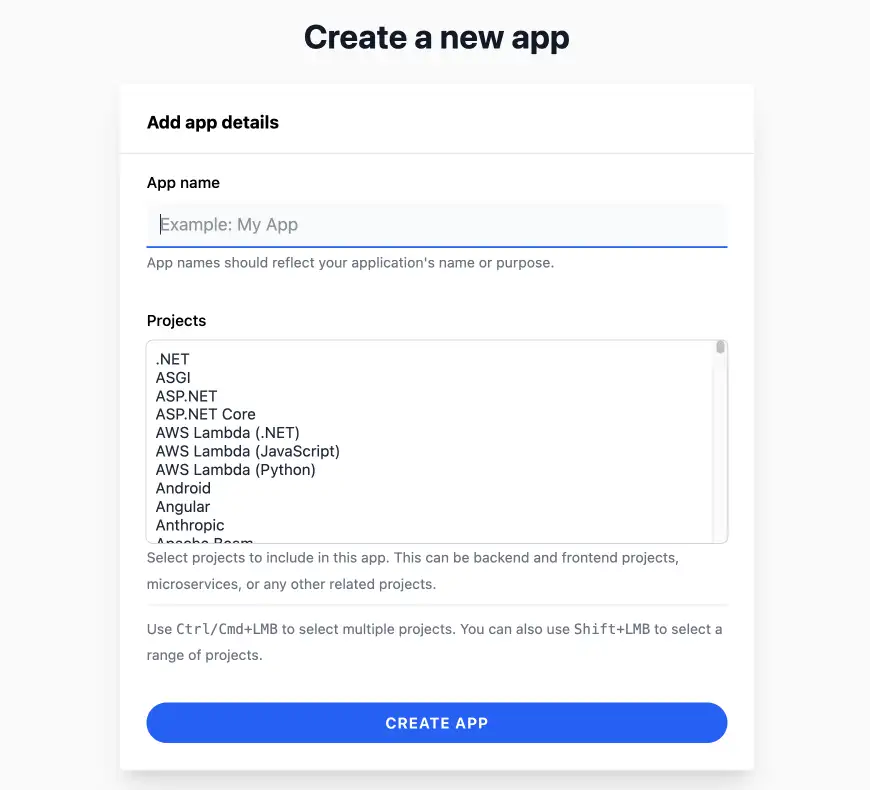
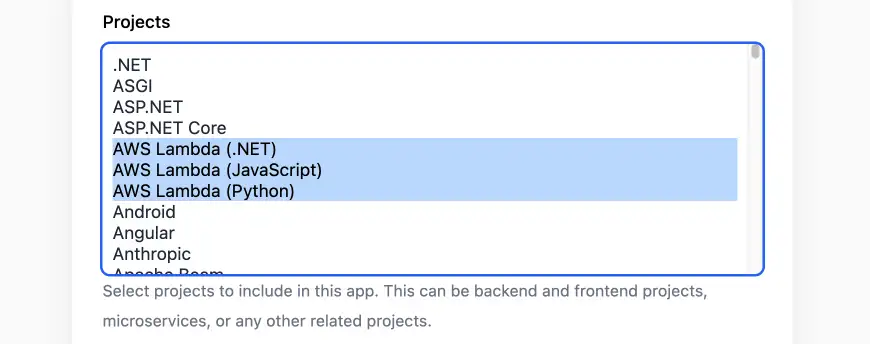
- In the Projects field, select one or more projects to include in the app. Use
Ctrl/Cmd+LMBto select multiple projects orShift+LMBto select a range. Only projects not already assigned to another app are available.
- Click Create app to save the app. You’ll be redirected to the projects dashboard with a confirmation message.
Notes 
- App names must be unique.
- You can group projects however you like, there’s no strict rule. Telebugs trusts your judgment on how to organize your projects.
- Only projects not assigned to other apps can be selected. To reassign a project, you must first delete the app it currently belongs to.
- After creation, the app will appear in the projects dashboard with a card displaying its name, project count, and a sparkline of recent error errors activity across all its projects.
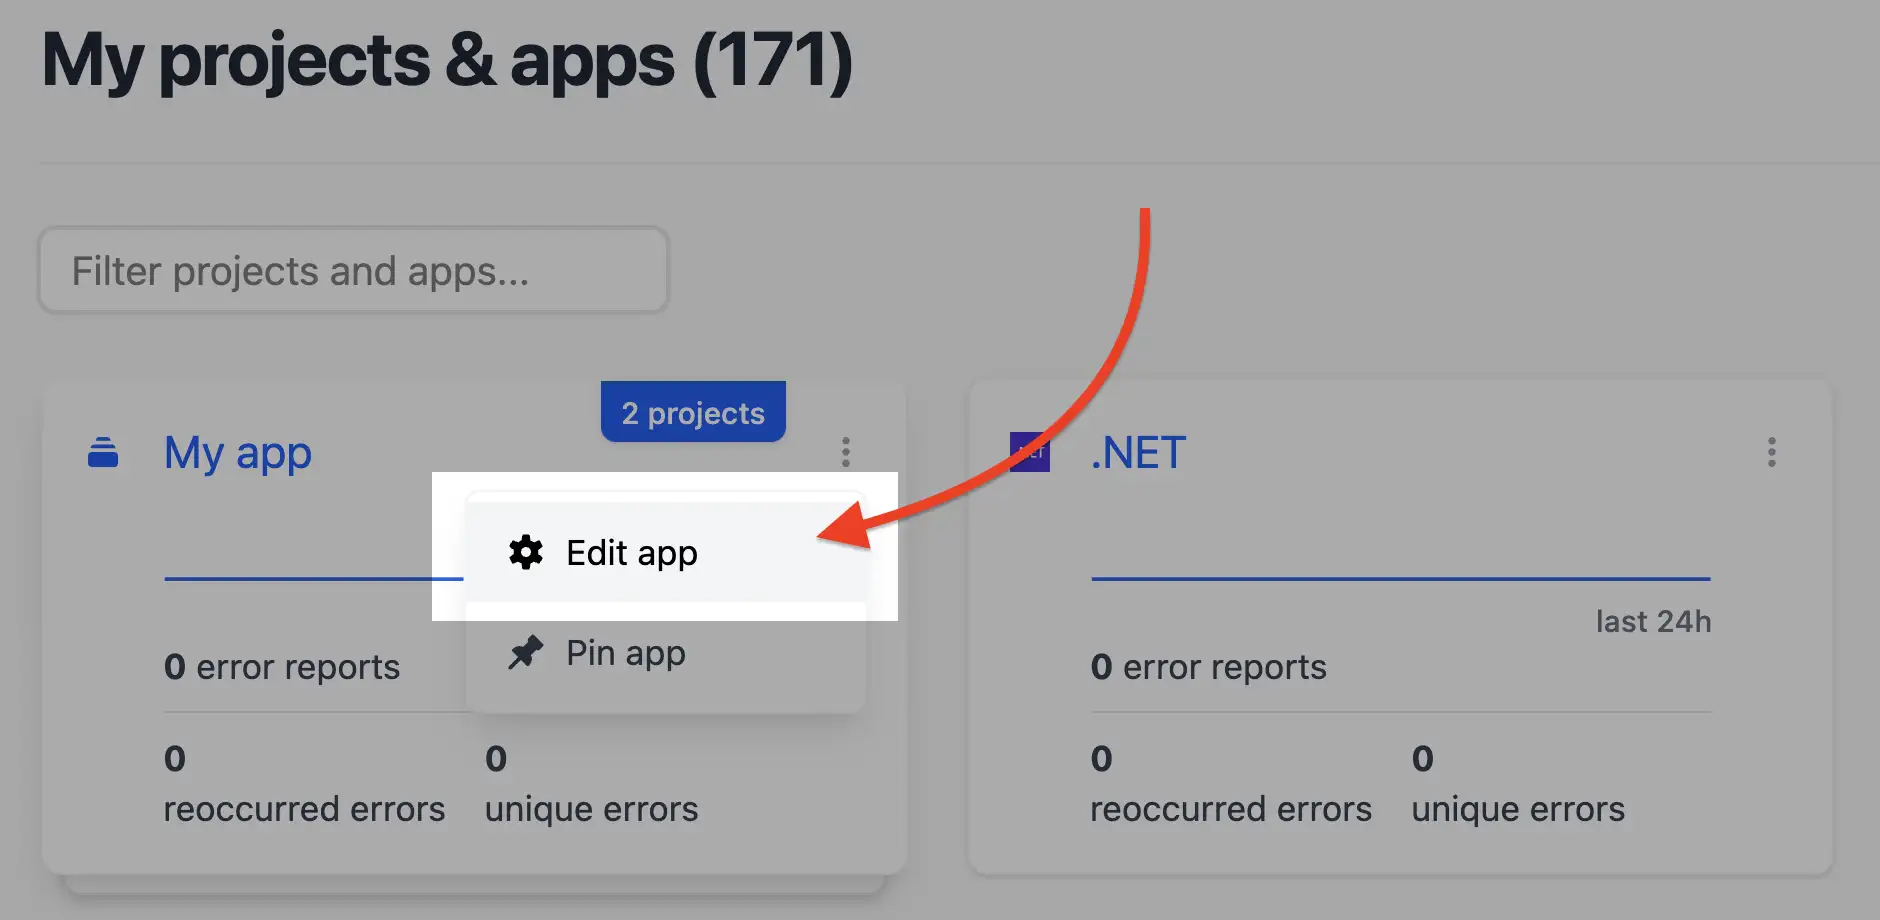
12.2 Editing an app 
To modify an app’s name or project assignments:
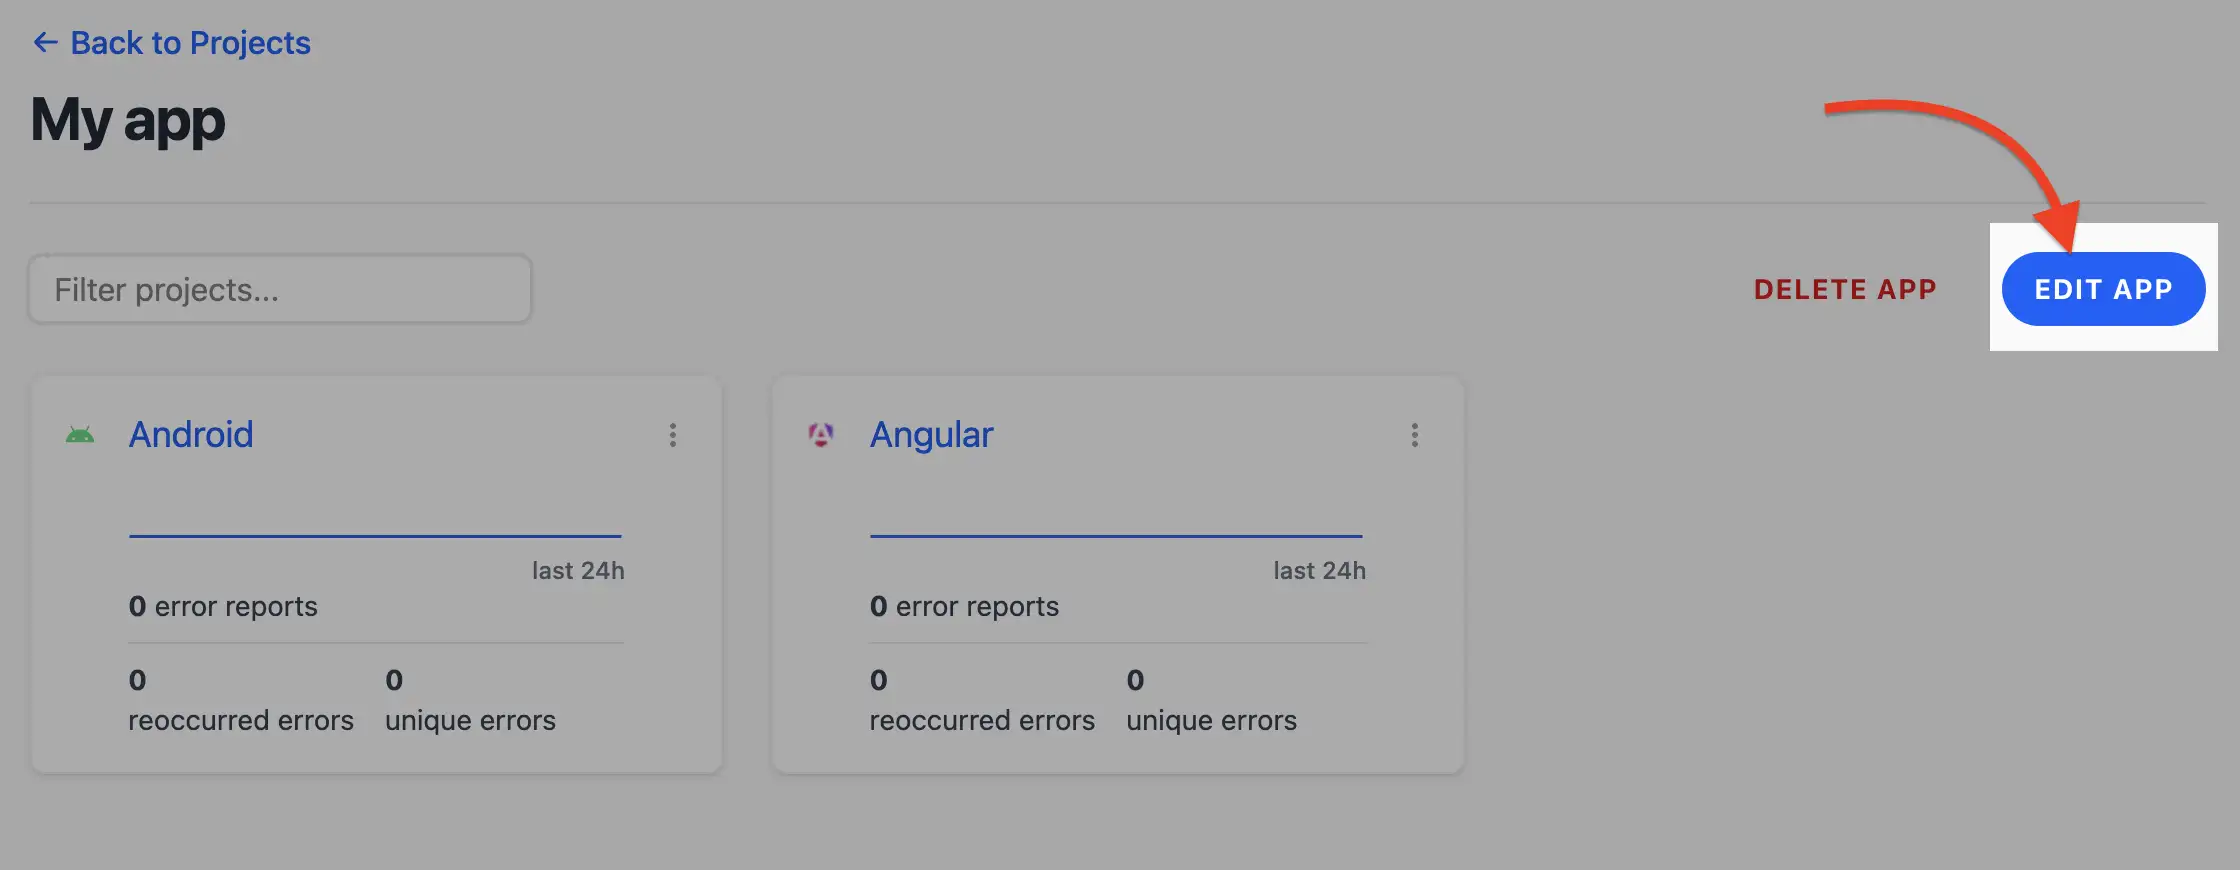
- From the projects dashboard, click the three dots on the app card and select Edit app.
- Alternatively, from the app’s view, click Edit App.
- Update the App name field if needed.
- Adjust the Projects field by selecting or deselecting projects. Use
Ctrl/Cmd+LMBfor multiple selections orShift+LMBfor a range.
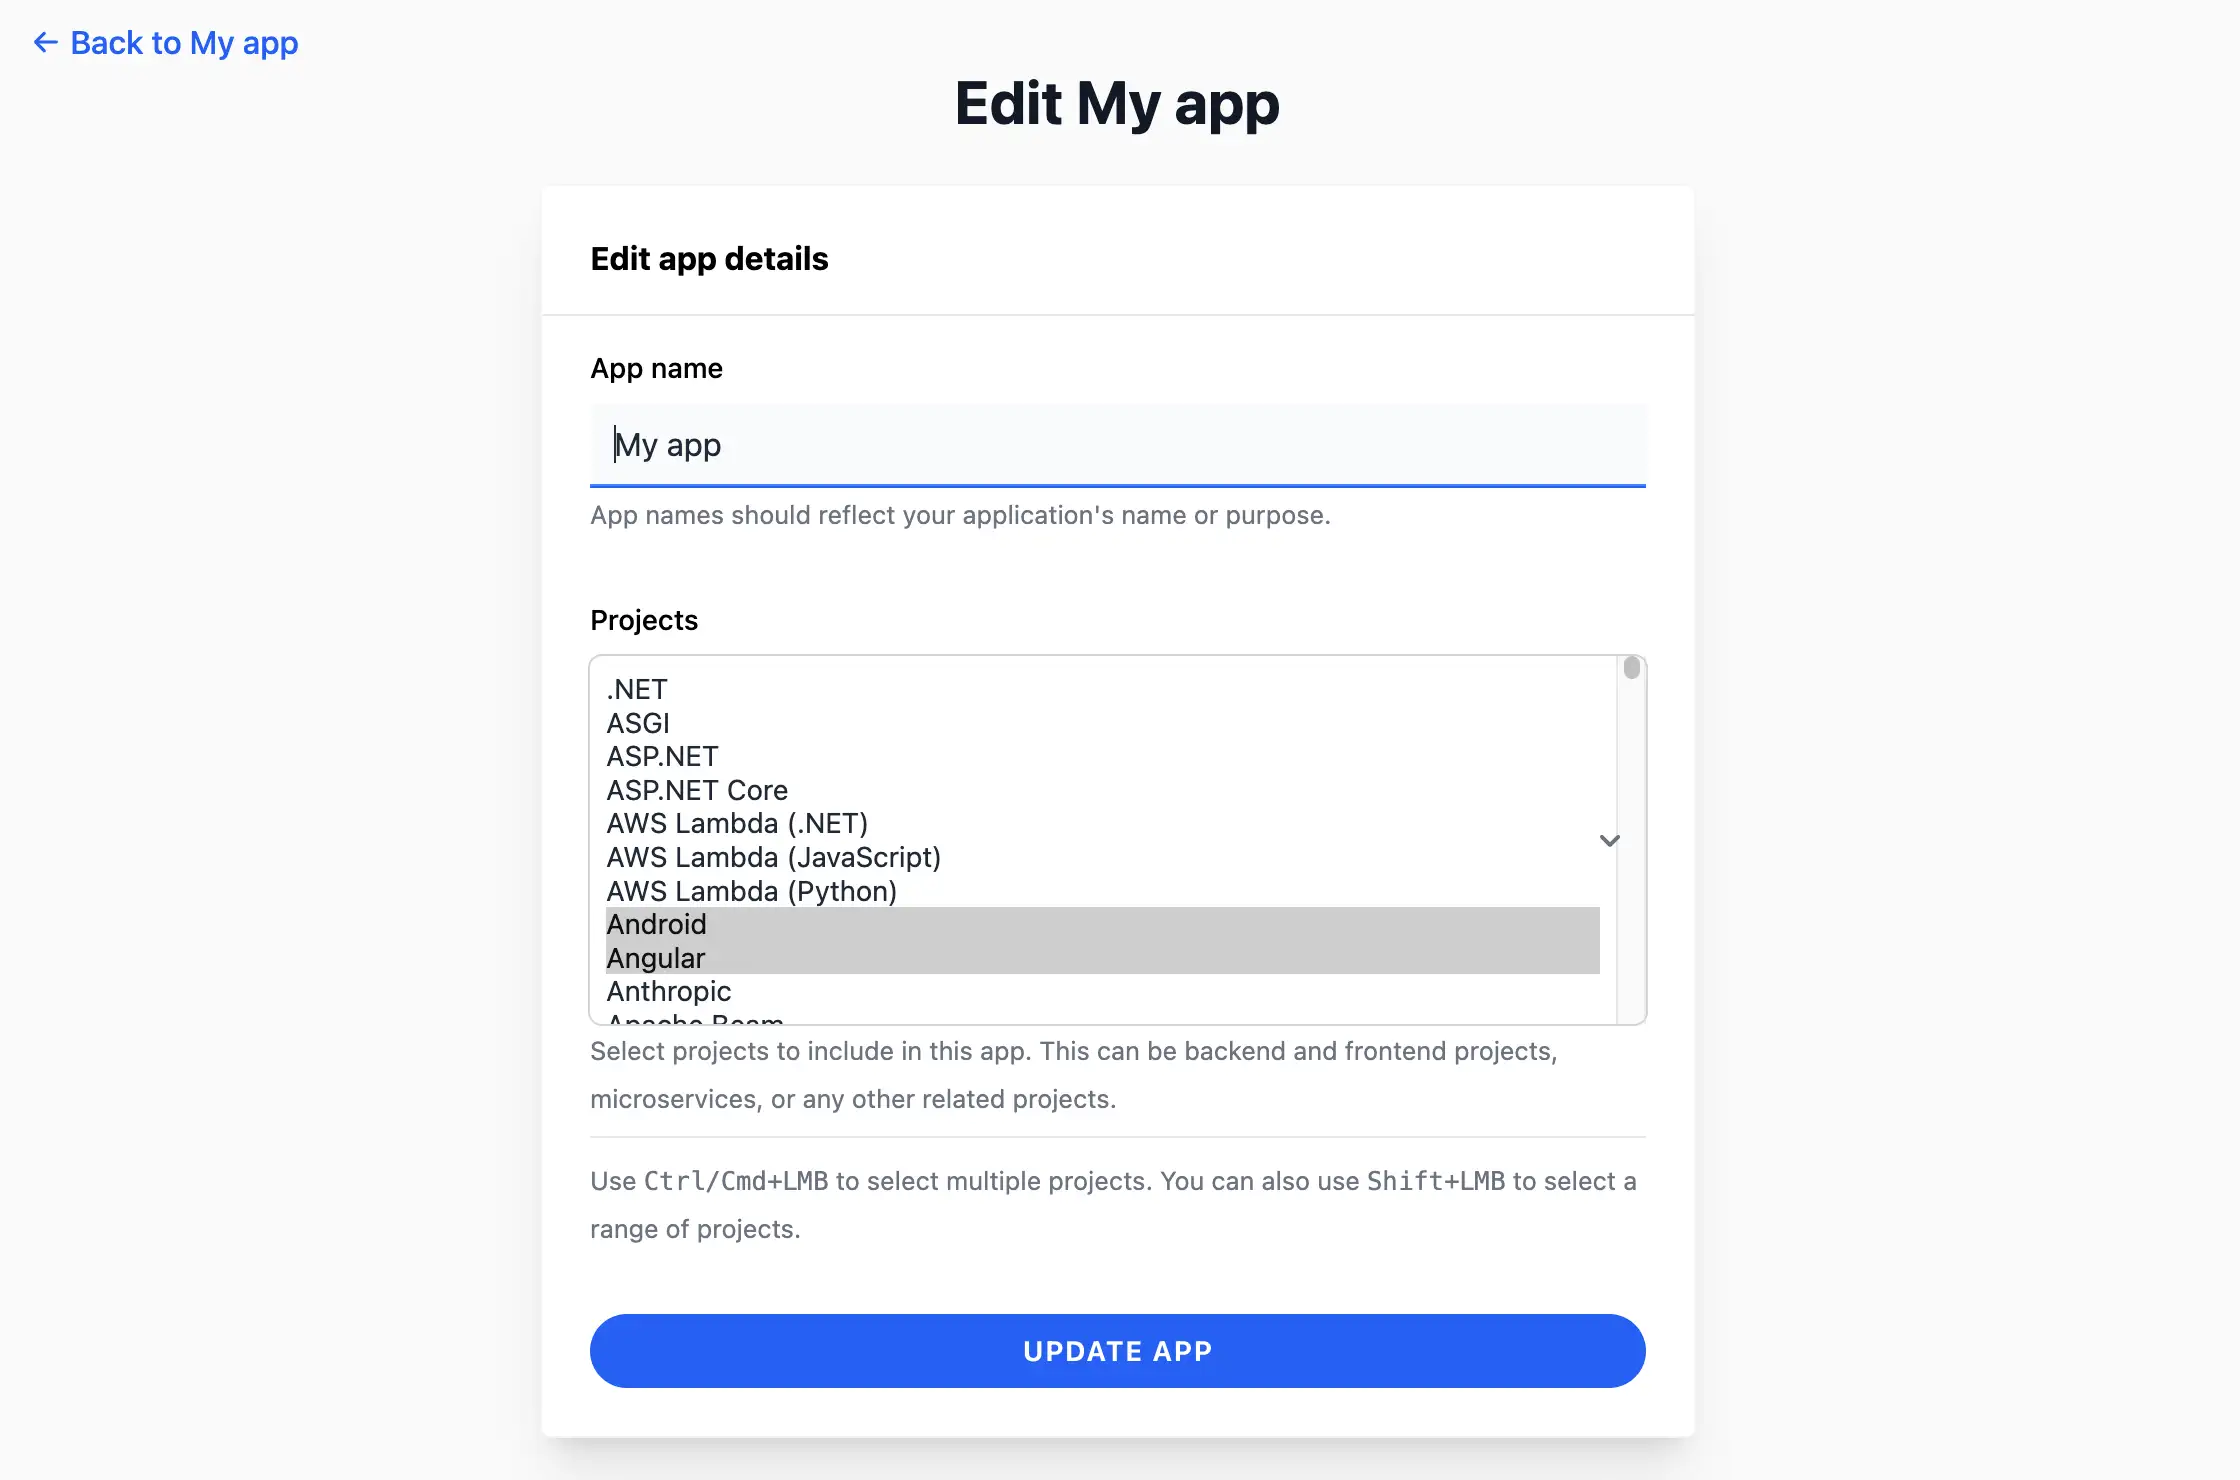
- Click Update app to save changes. You’ll be redirected to the projects dashboard with a confirmation.
Notes 
- Changes to project assignments are immediate. Deselected projects become standalone and can be reassigned to another app.
- If a project is removed from an app, its error reports and settings remain unaffected.
12.3 Pinning and unpinning an app 
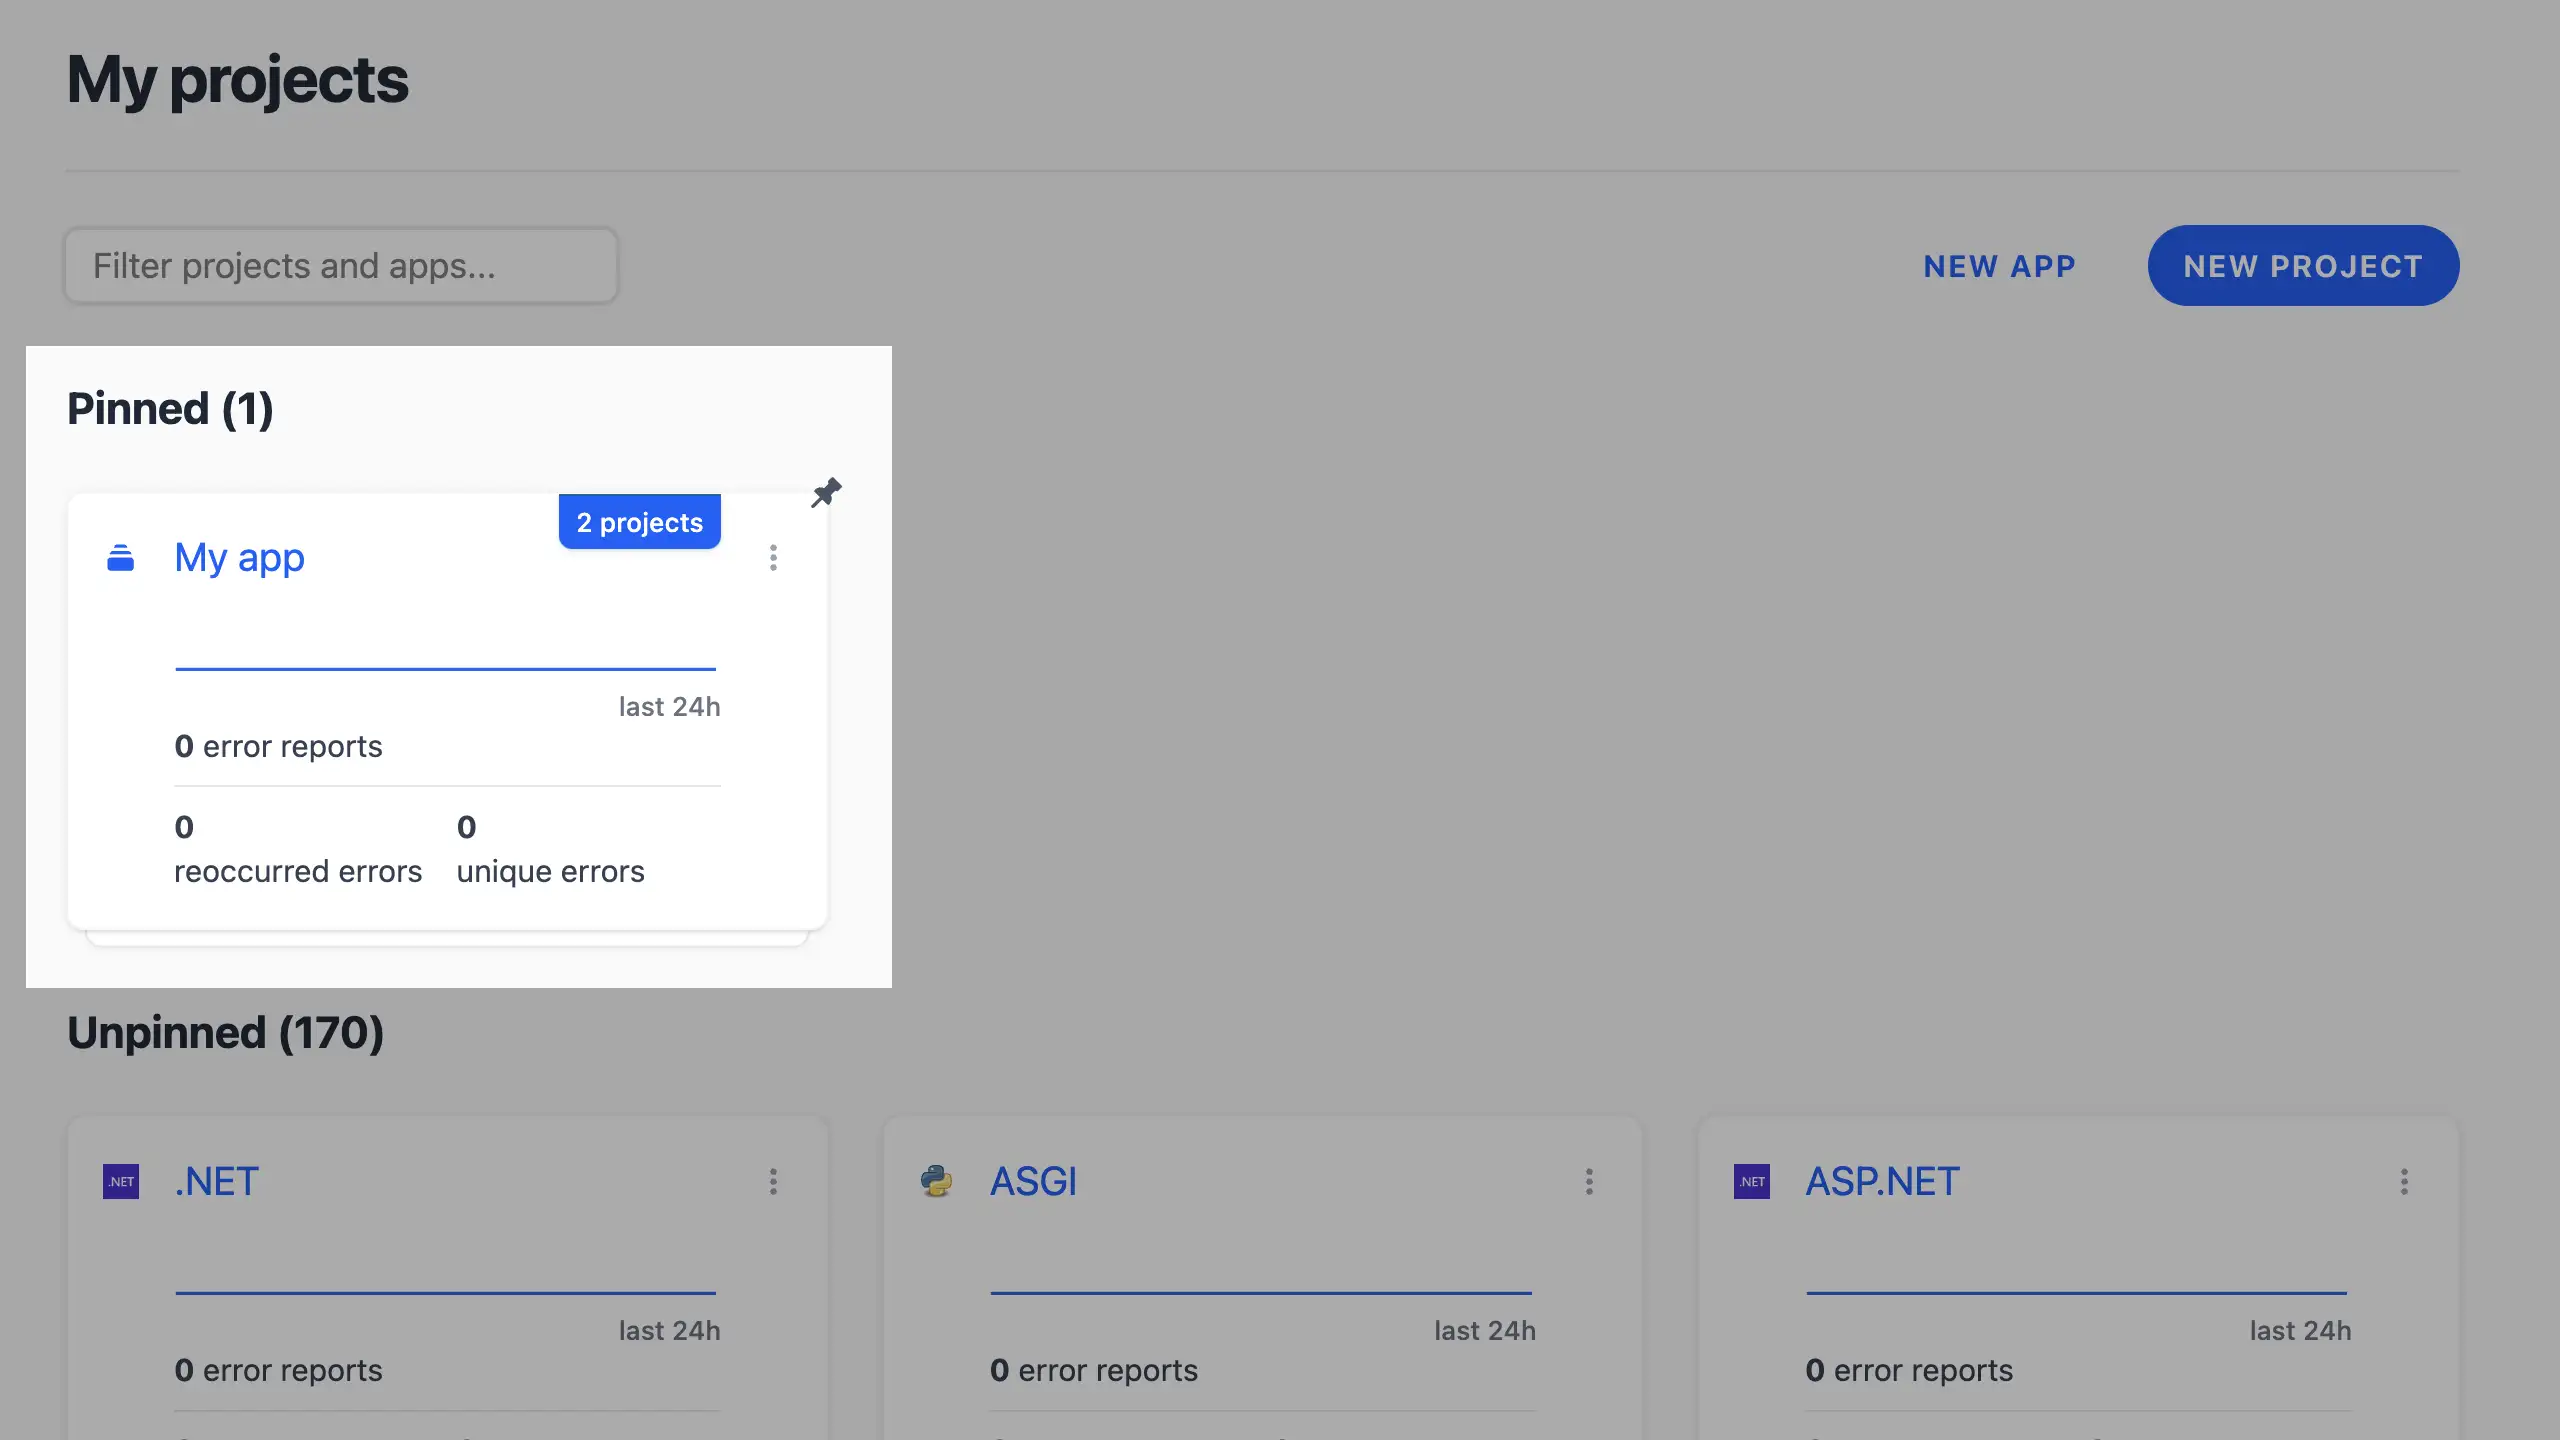
Pinning an app keeps it at the top of the projects dashboard for quick access. To pin or unpin:
- In the projects dashboard, click the three dots on the app card.
- Select Pin app to pin it or Unpin app to remove the pin.
- Pinned apps display a pin icon and remain at the top of the grid.
12.4 Deleting an app 
To delete an app:
- From the app’s view, click Delete app.
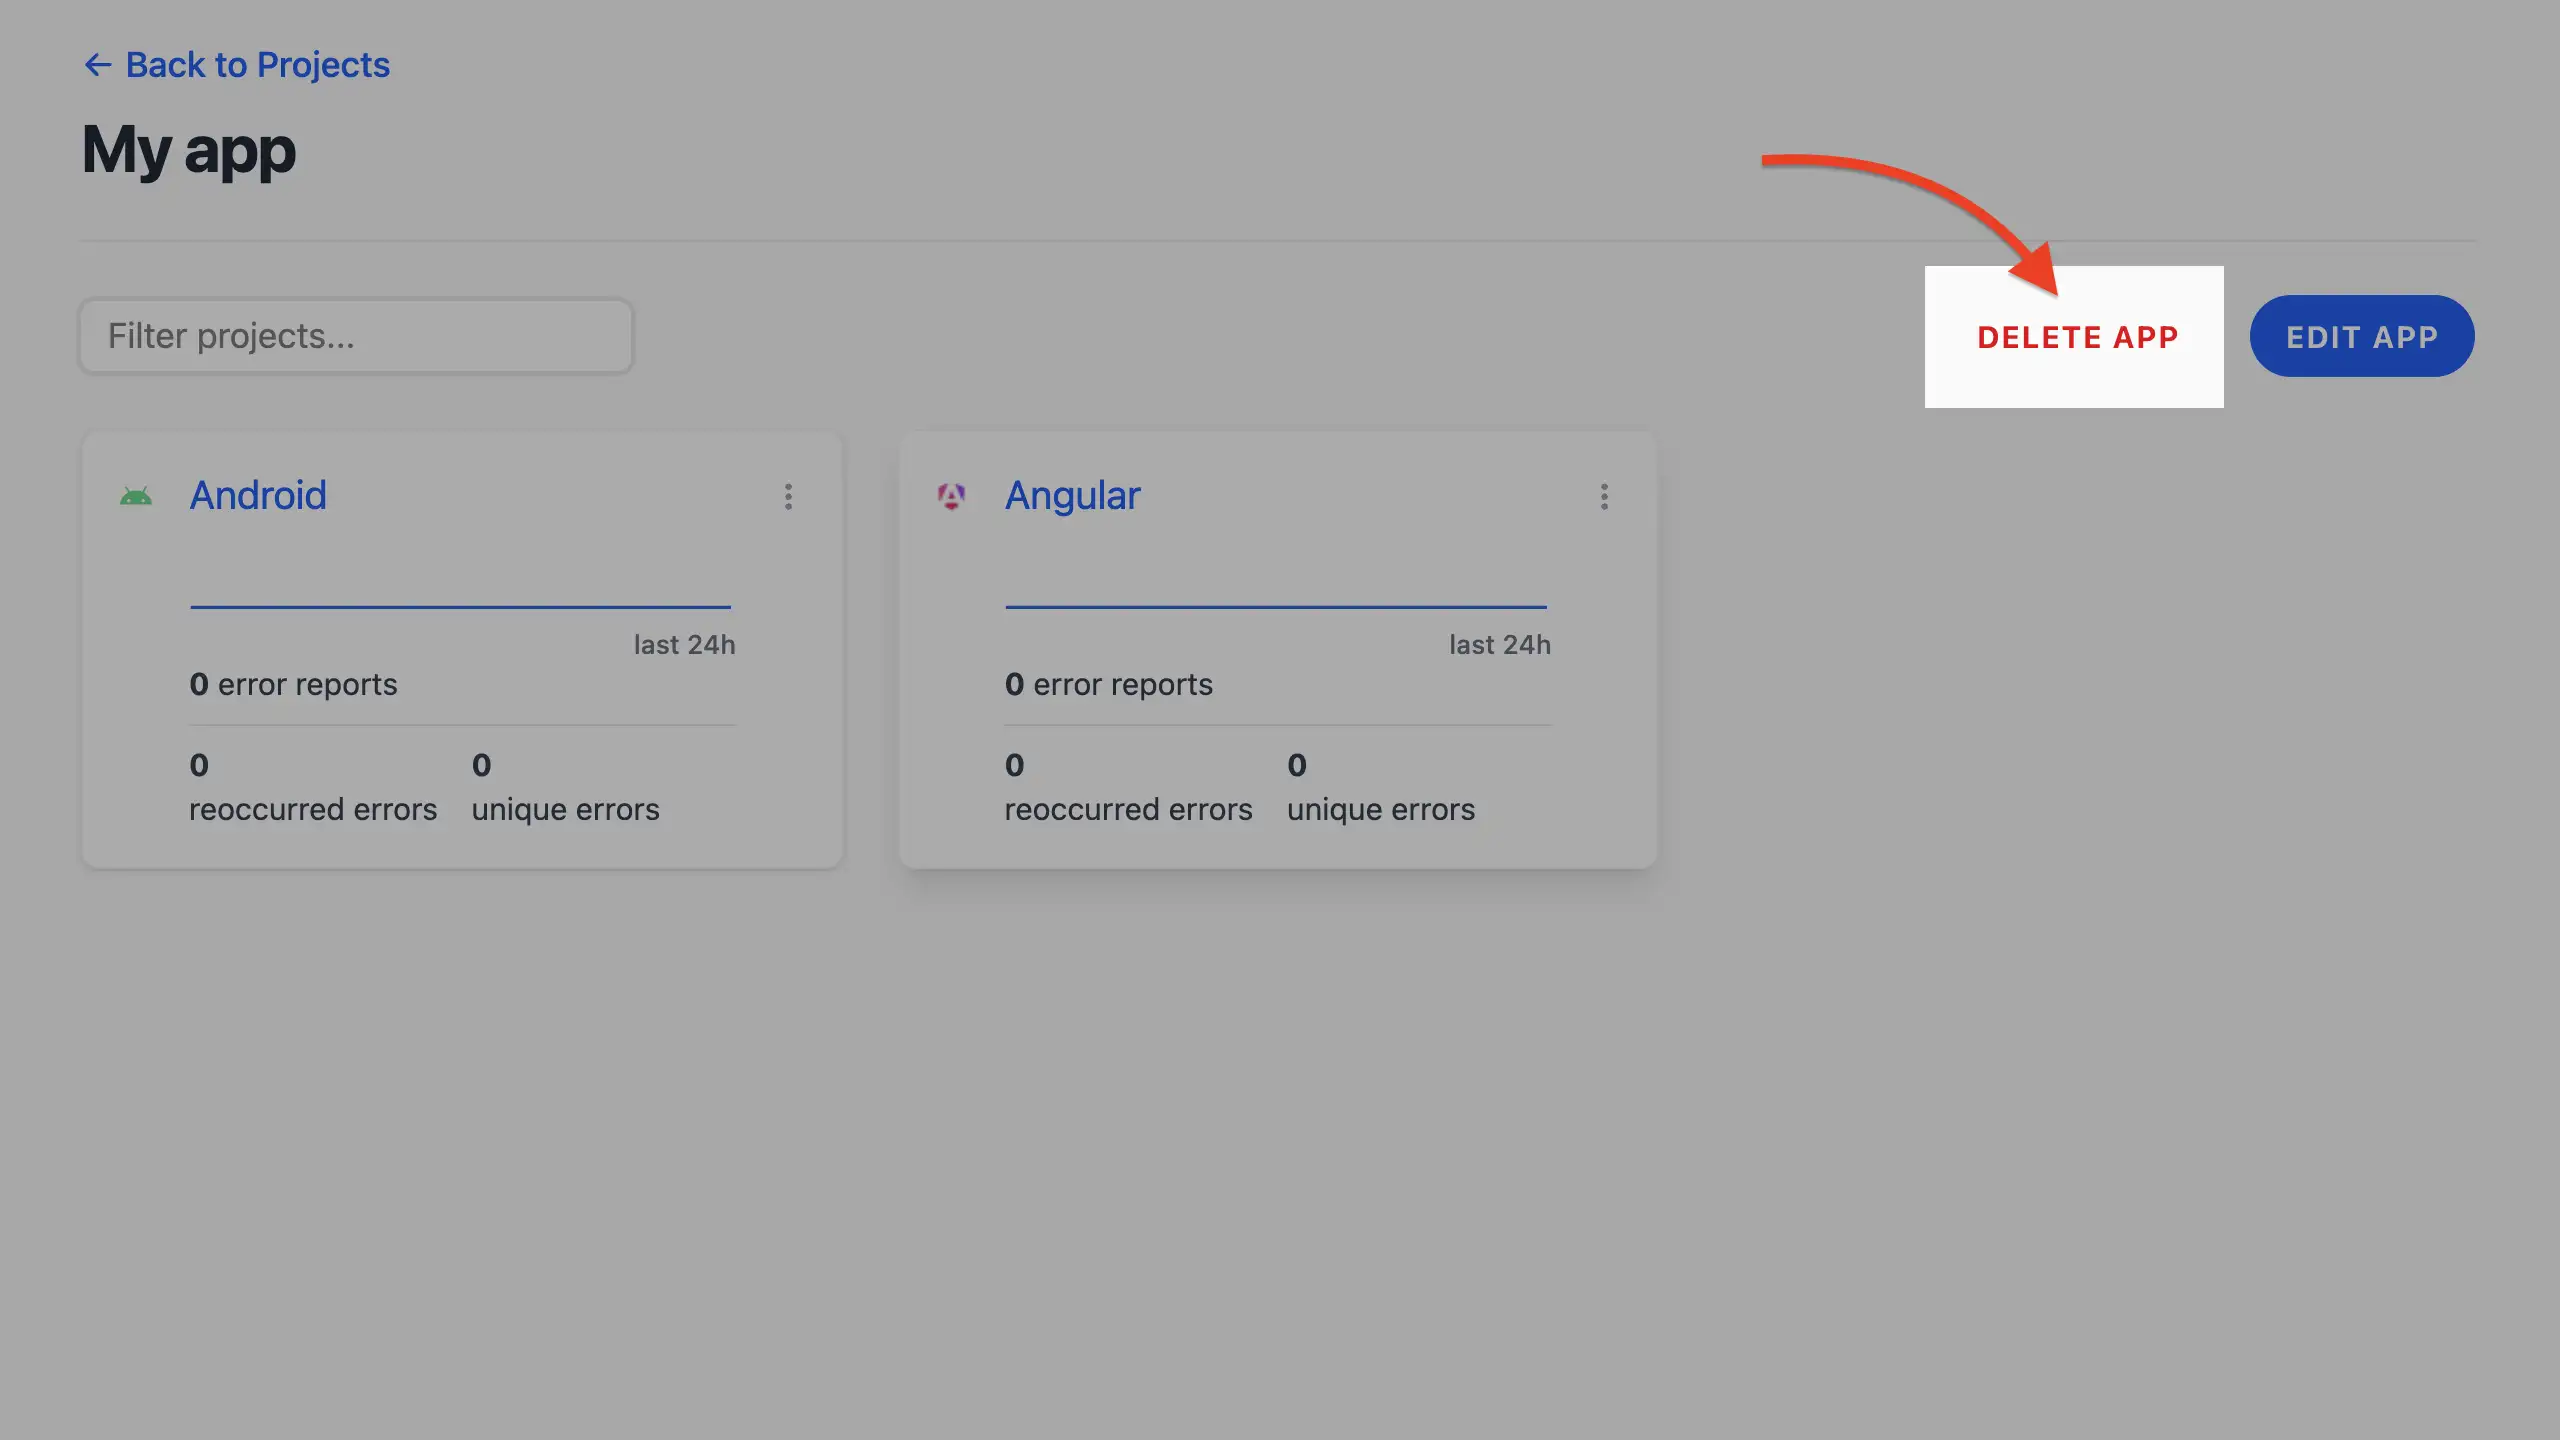
- Confirm the deletion in the dialog that appears. This ensures you don’t accidentally delete the app.
- After deletion, you’ll be redirected to the projects dashboard with a confirmation message. The app’s projects become standalone and can be reassigned to another app.
Notes 
- Deleting an app does not delete its projects or their error reports. It only removes the app grouping.
13 Releases 
Releases in Telebugs let you tag versions of your app, mainly to link source maps for unminifying stack traces in error reports. This keeps your debugging clean by mapping minified code back to readable sources. They’re straightforward — no bells and whistles beyond sourcemap support right now. In this chapter, we’ll cover the basics: viewing your releases, adding new ones, and managing them including artifacts and deletion.
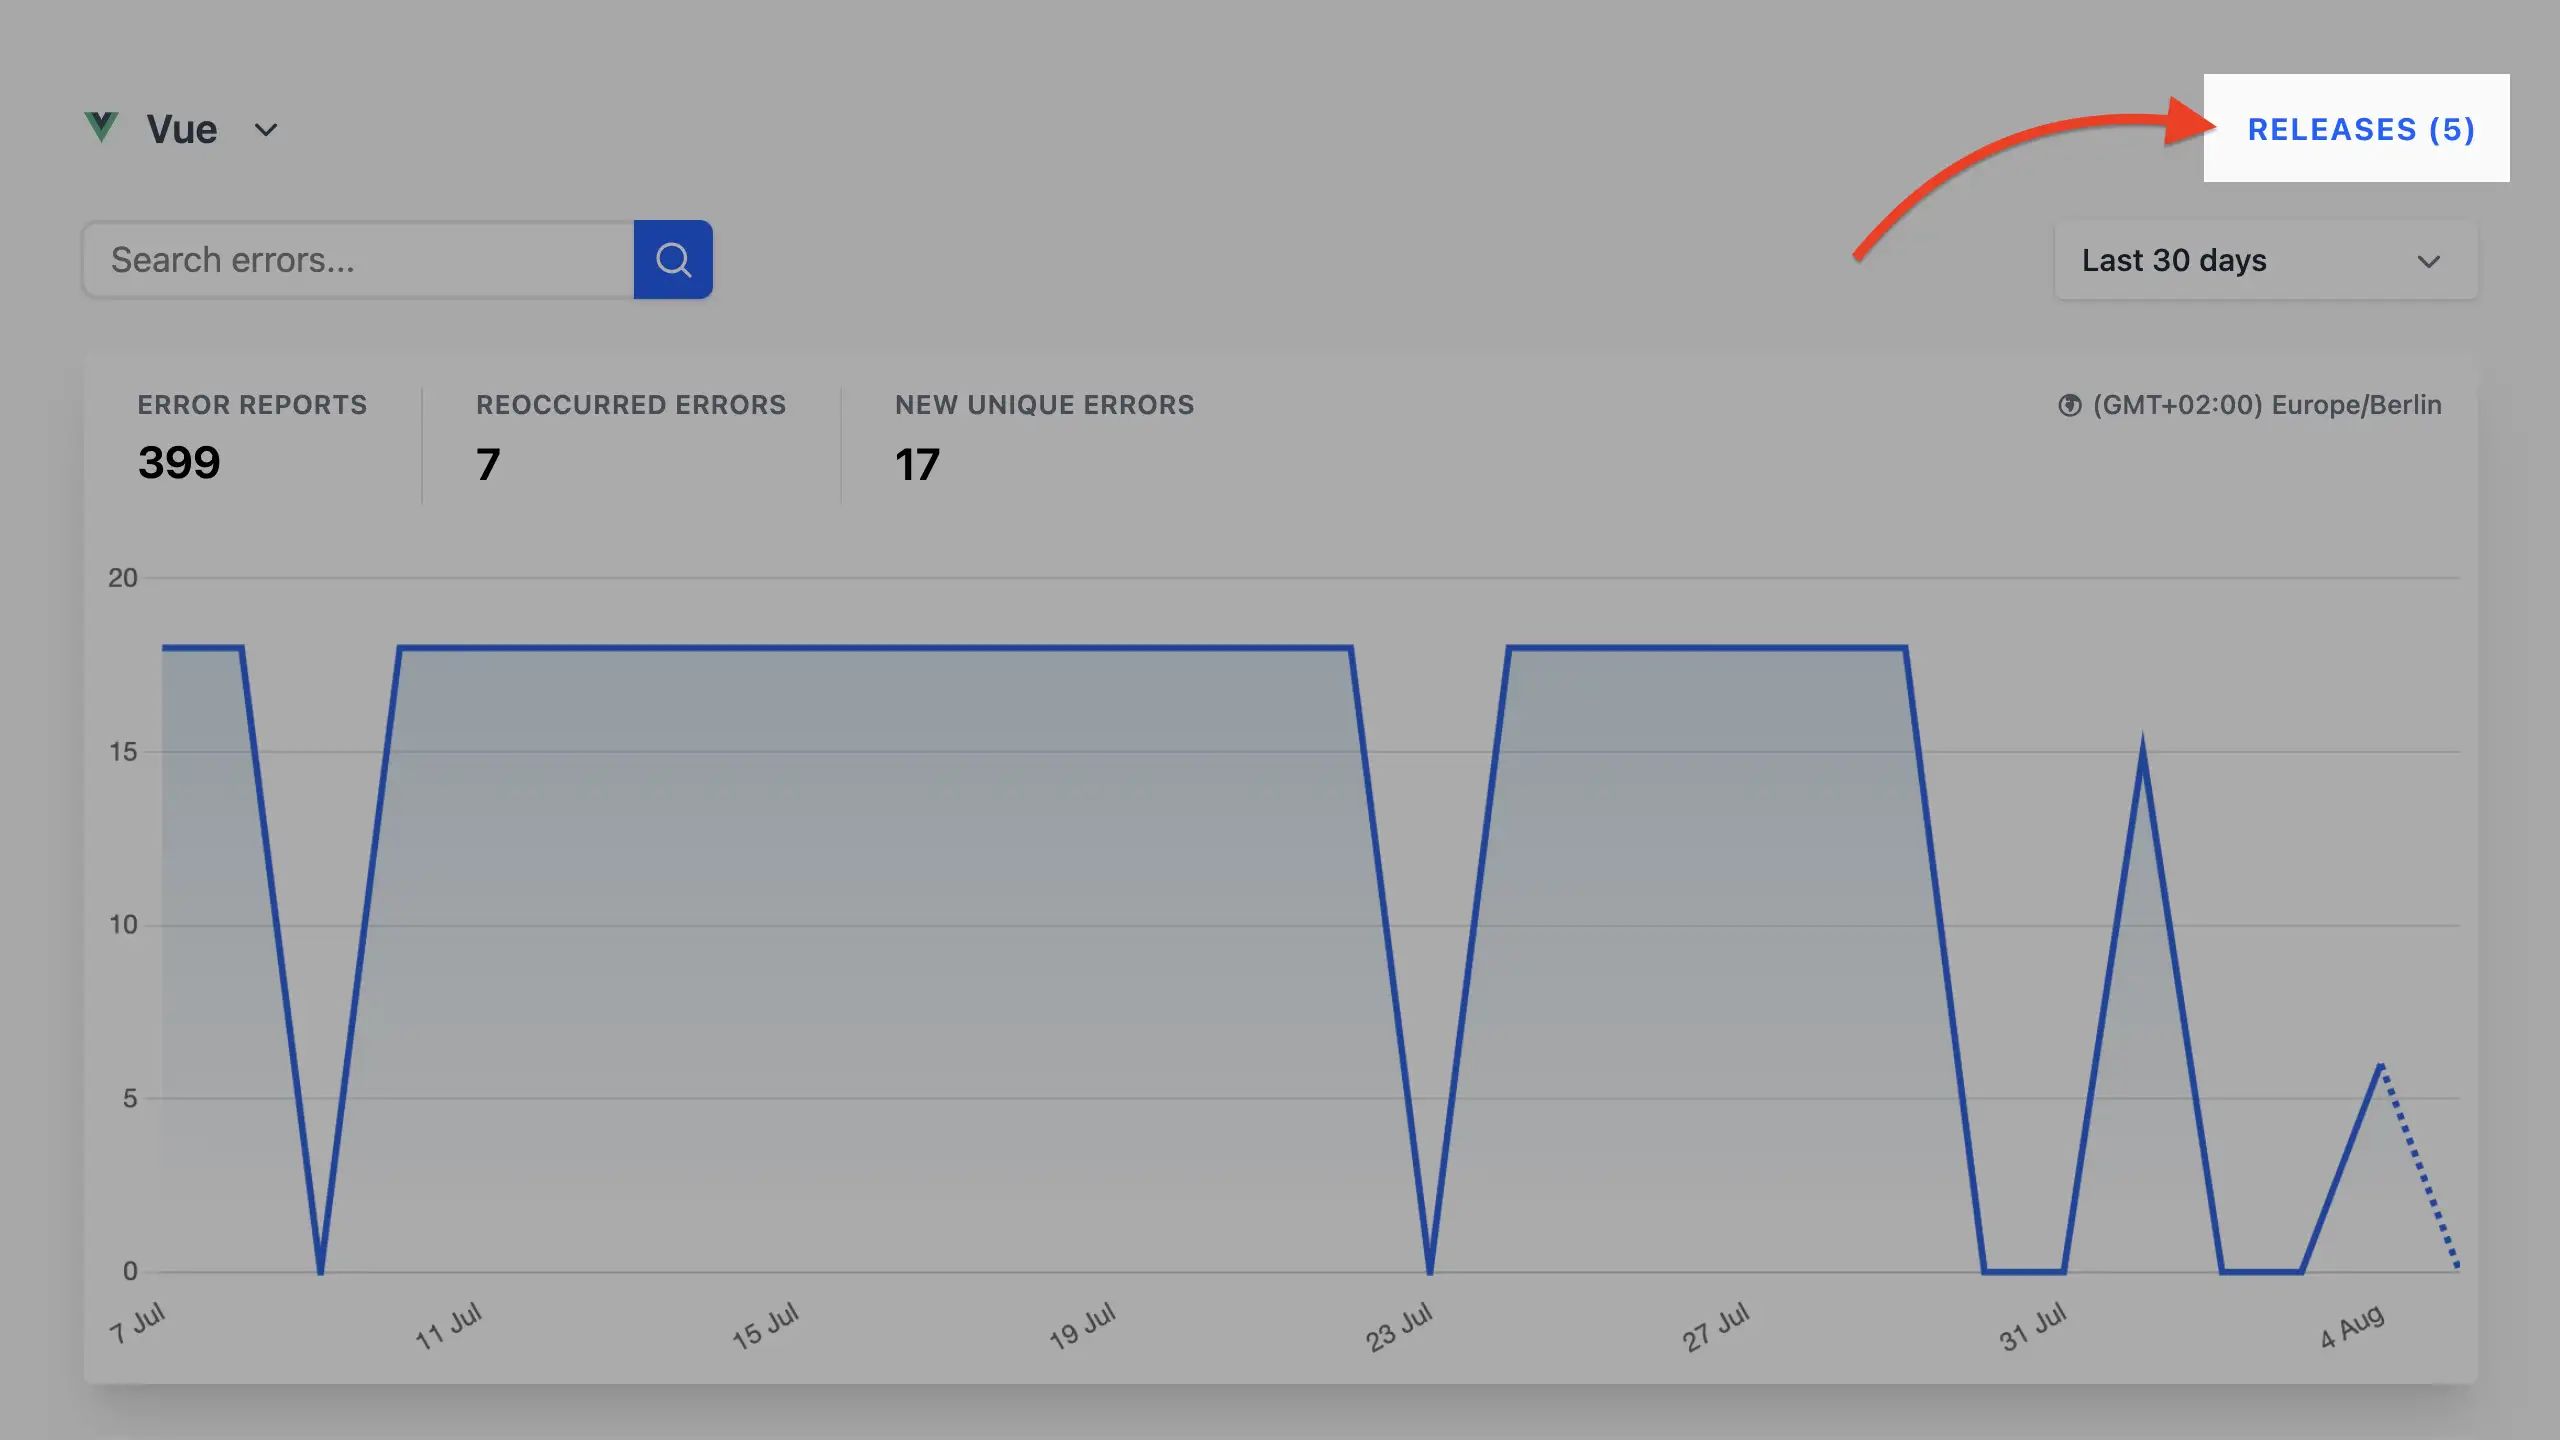
13.1 Releases overview 
In your project dashboard (see Individual project view), spot the "Releases (N)" link top-right. It shows the count and jumps you to the list. Releases here are tied to source maps, so if you’re using minification, this is key for actionable stack traces.
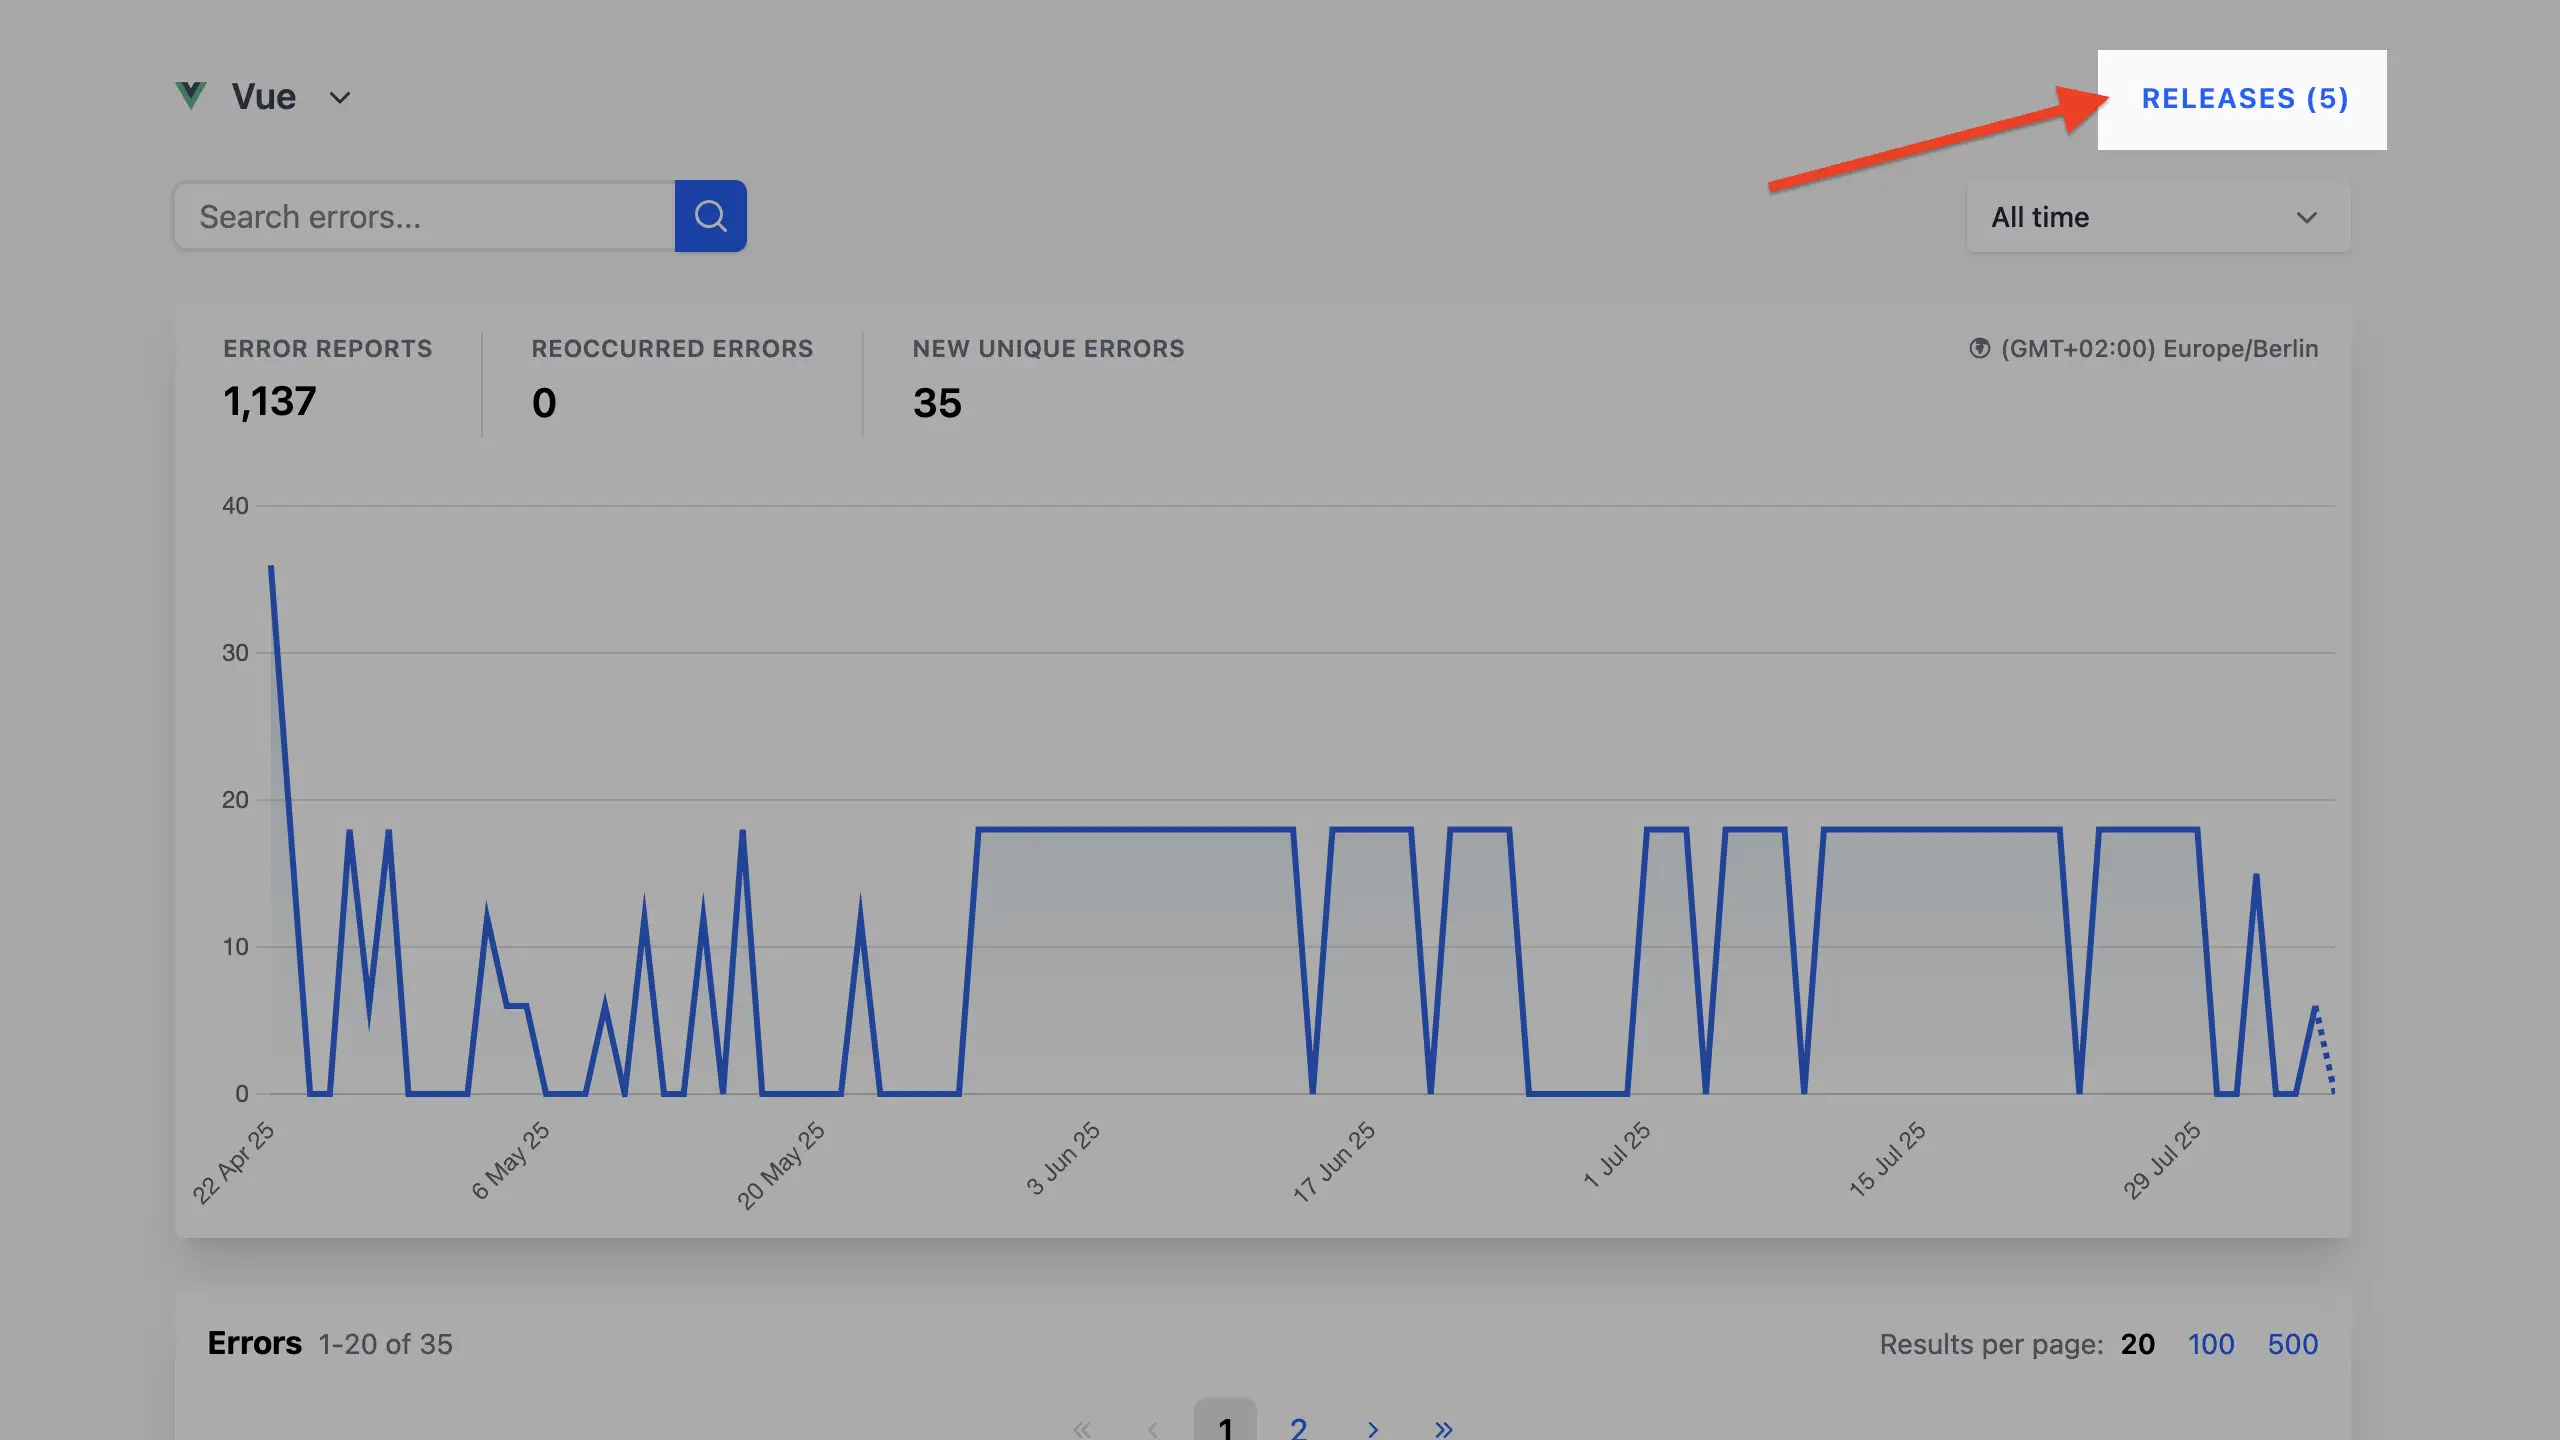
Pro tip: Set releases during deploys to ensure source maps match versions accurately.
13.2 Viewing releases 
The releases index is a simple chronological list. Each entry shows:
- Version: Your tag (e.g., "v1.2.3").
- Timestamp: Creation time.
- ID: A unique identifier for the release.
- Artifacts: Attached source maps or other files.
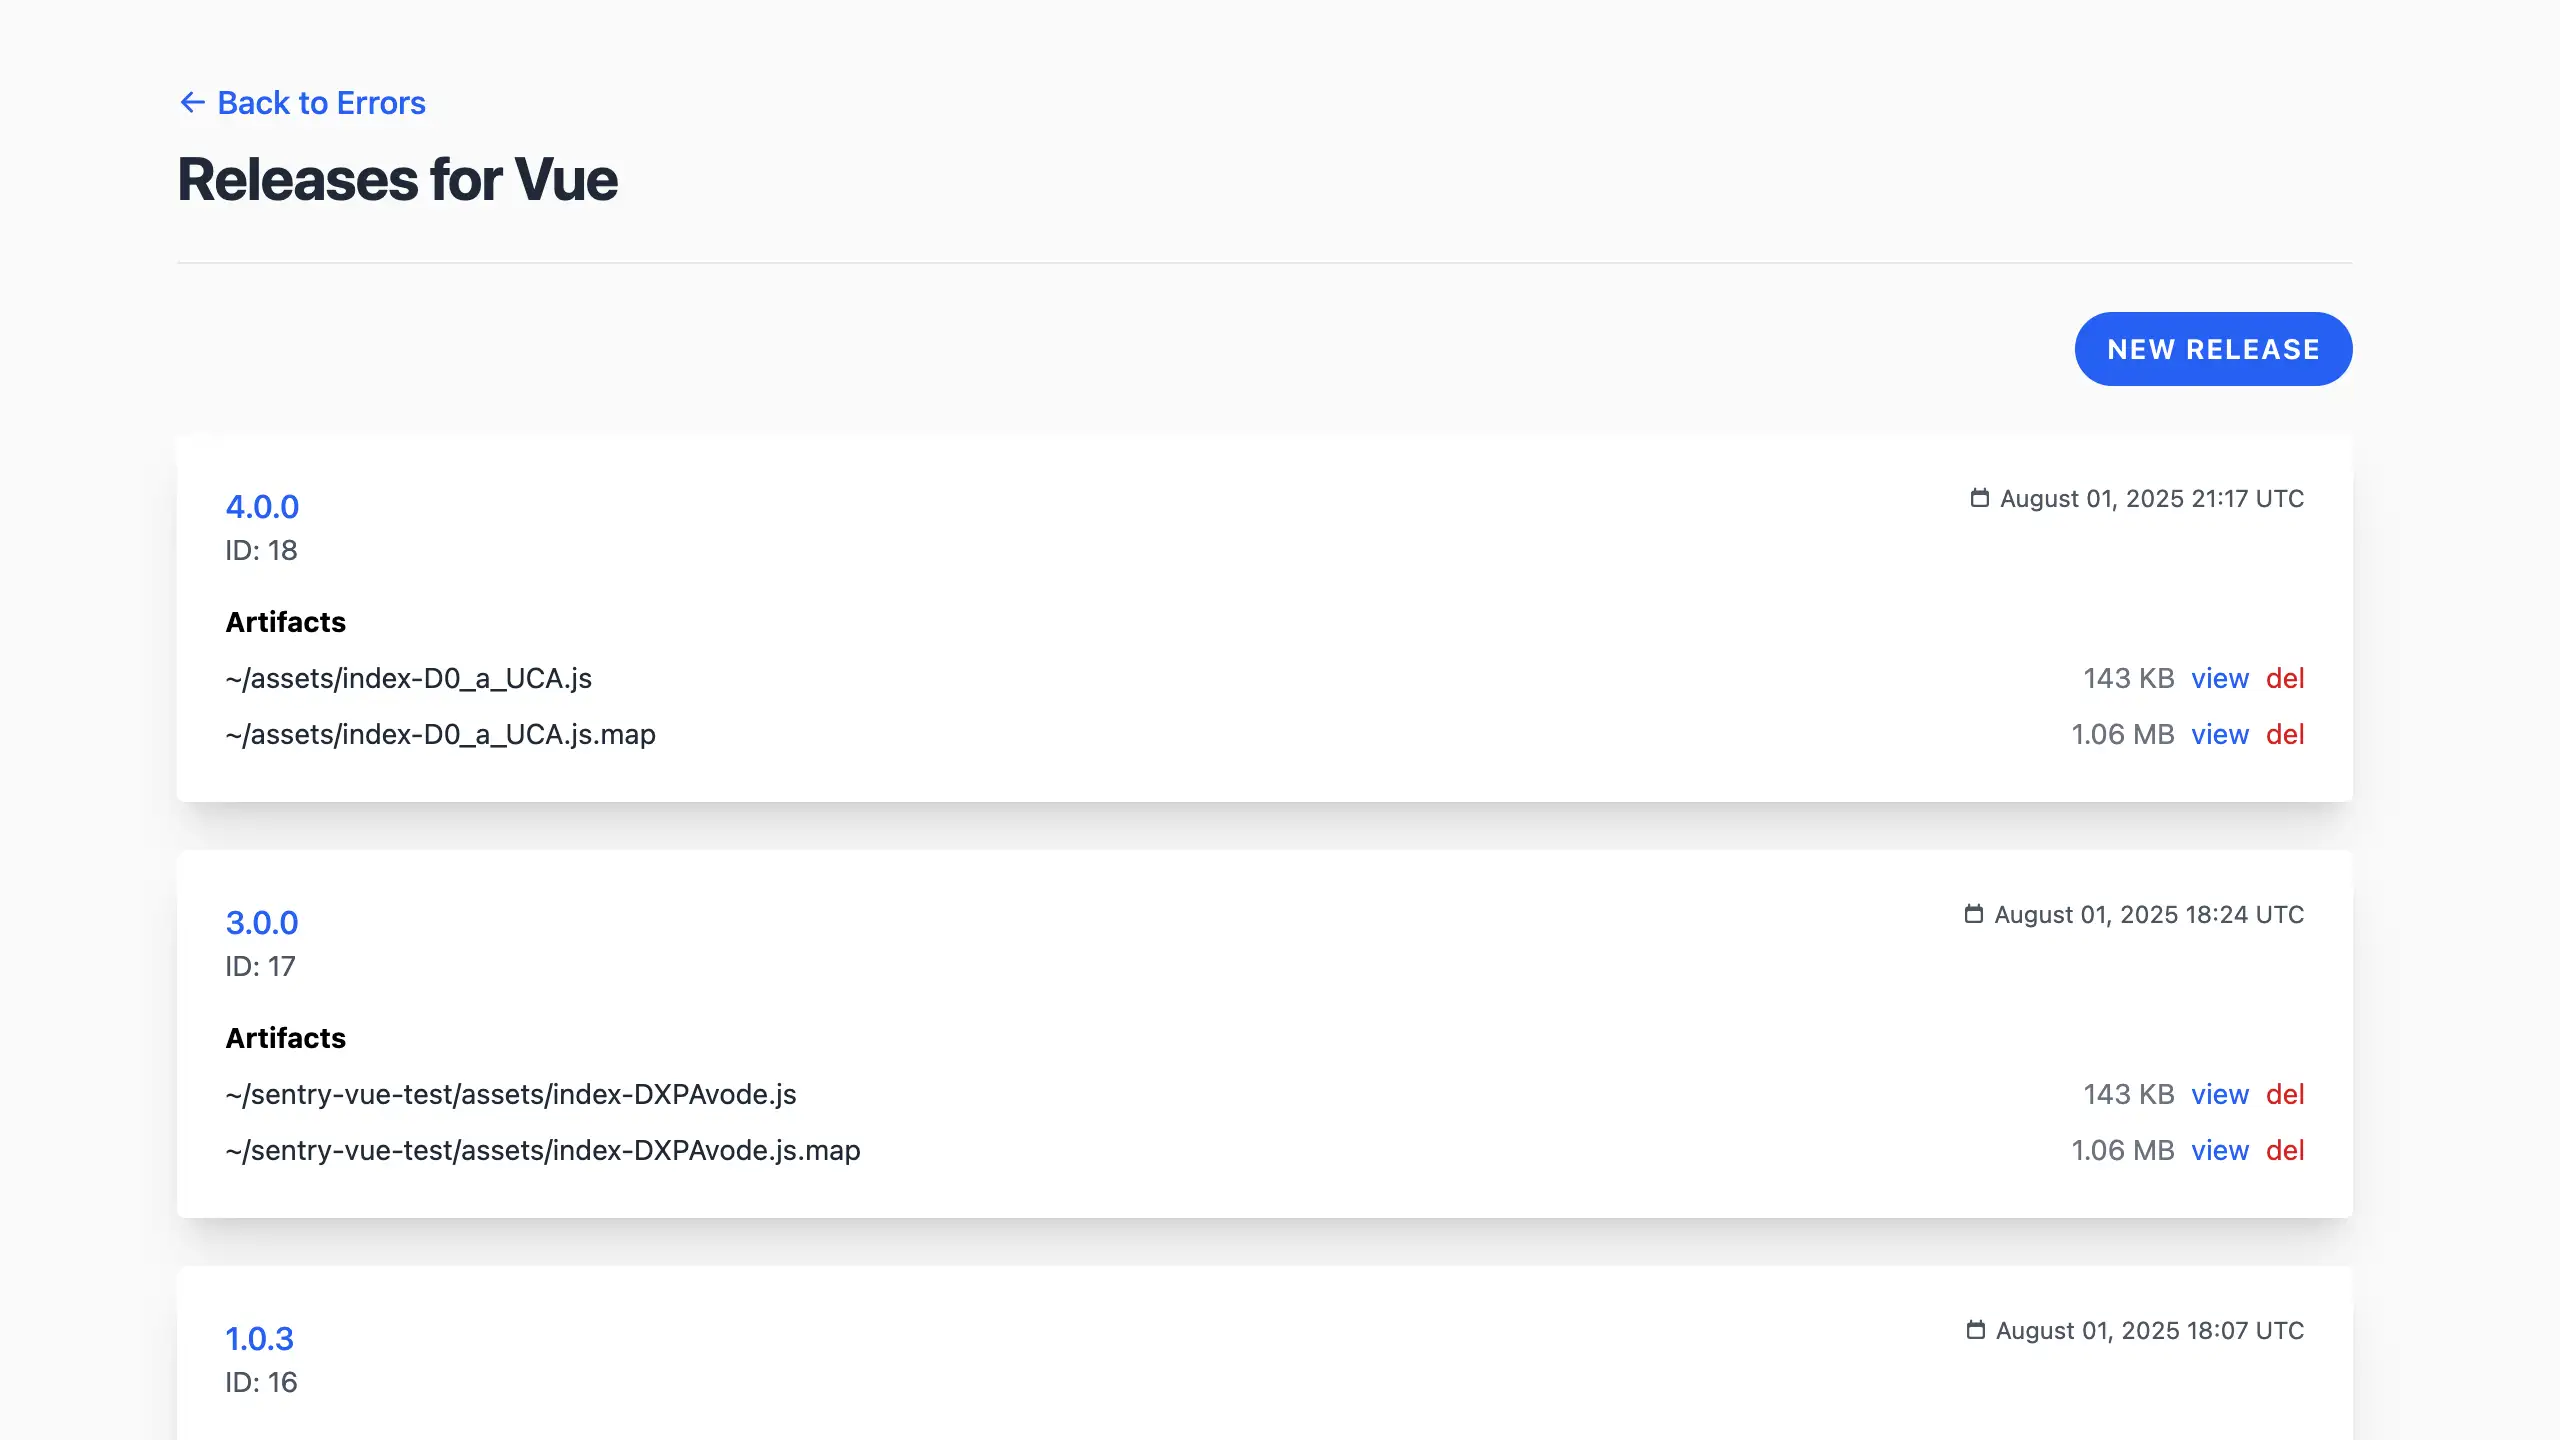
Quick tip: Check here post-deploy to verify source maps uploaded correctly.
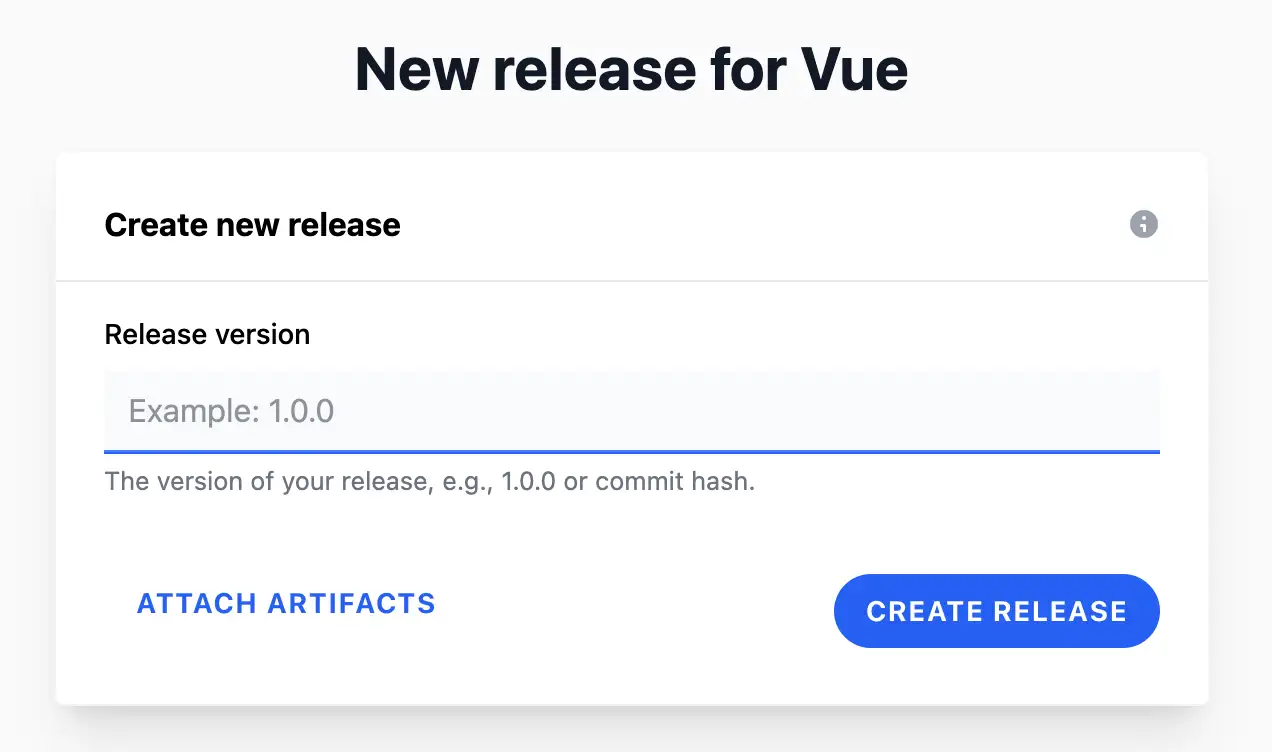
13.3 Creating releases 
Creating a release is easy, either manually, via SDK/API for automation, or using the Sentry CLI. In the UI:
- From the releases index, click New Release.
- Add version and upload source maps if needed.
- Save — it’s ready for error mapping.
Via SDK (example in JS):
Telebugs.setRelease('v1.2.3');
// Then upload source maps separately if required
Via Sentry CLI: Set the environment variables as described in Uploading source maps, then run:
sentry-cli releases new <version>
Focus on including source maps; that’s the core value for now.
Quick tip: Integrate with your build process for automatic release creation and sourcemap uploads.
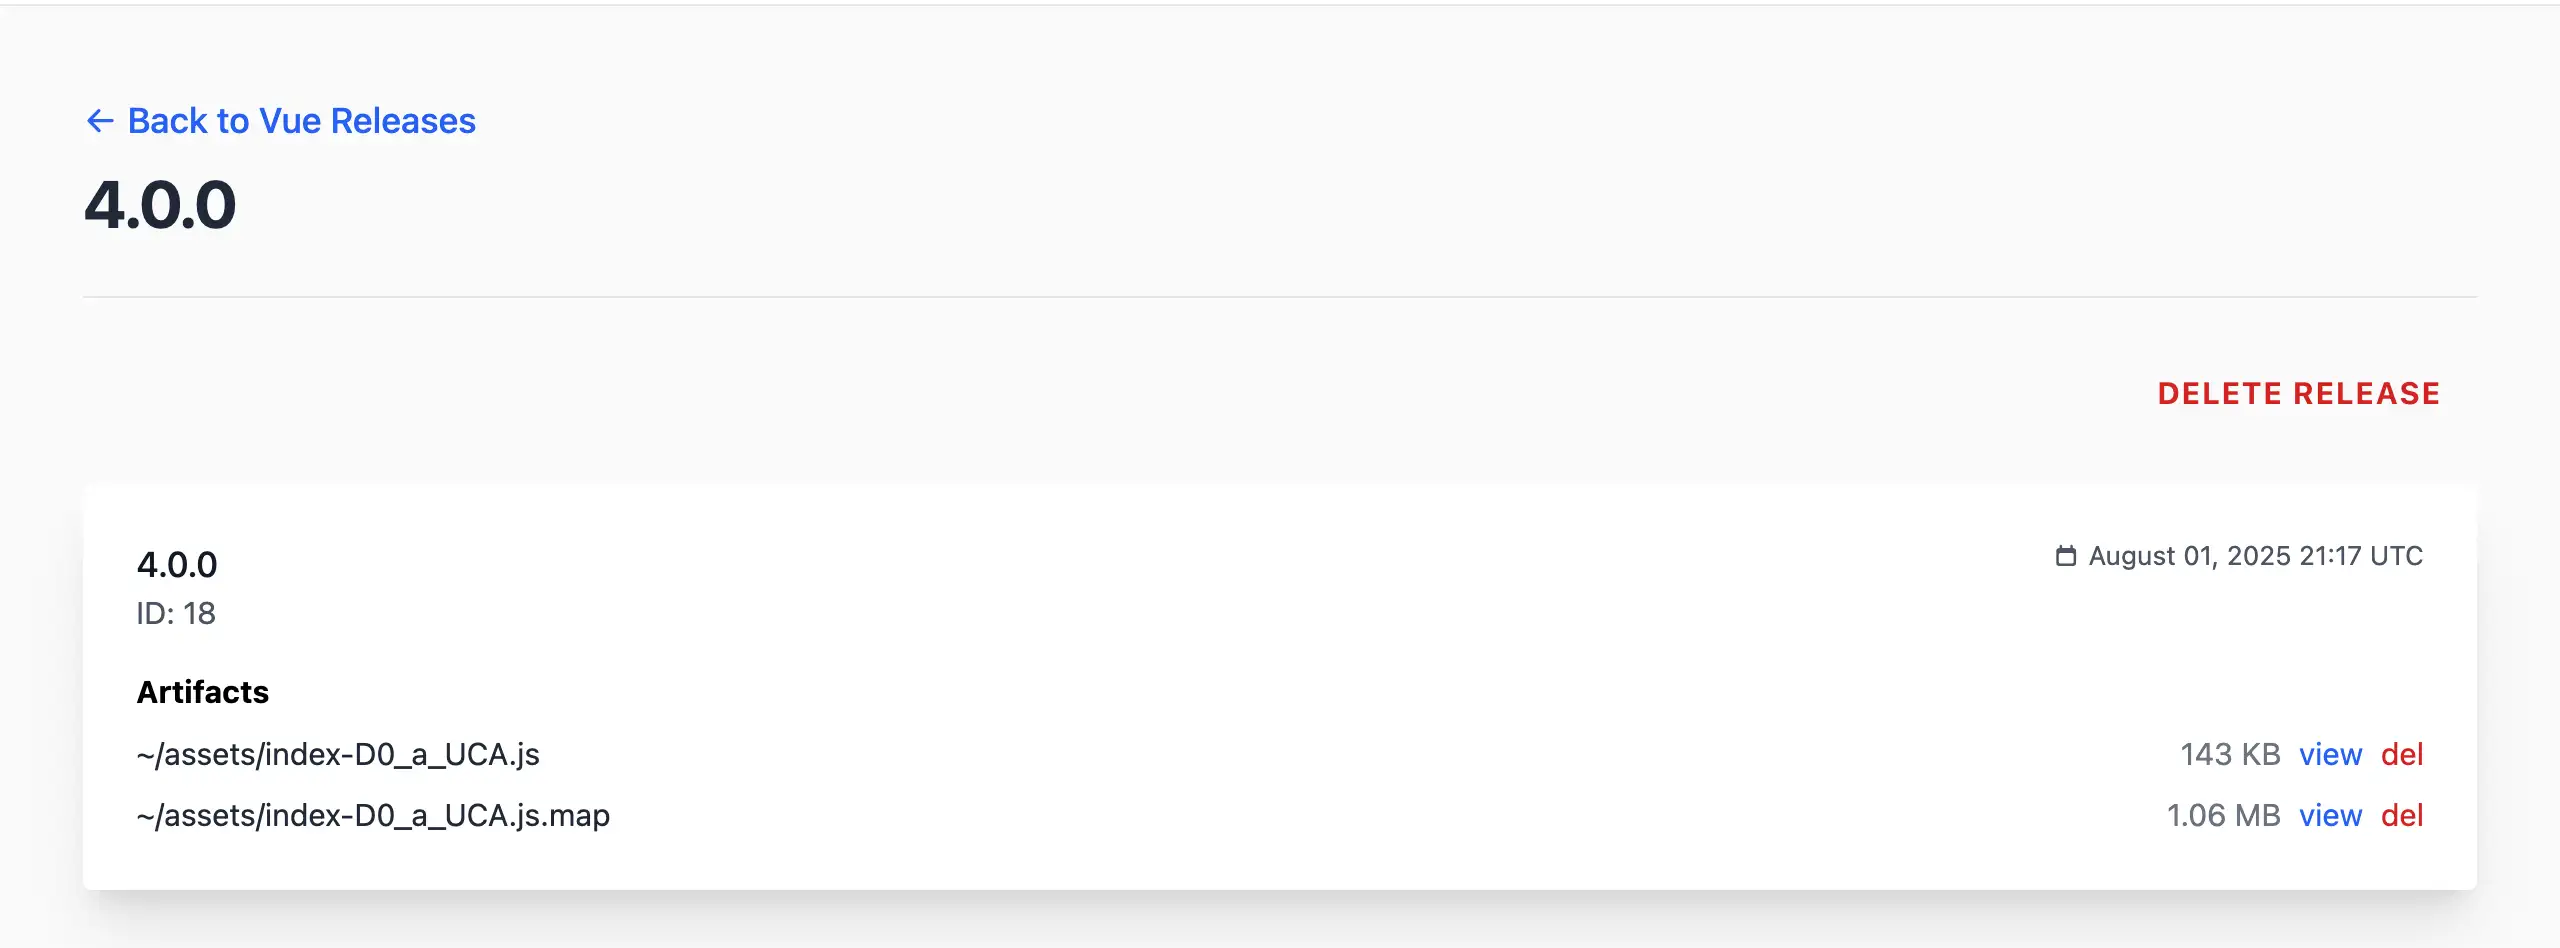
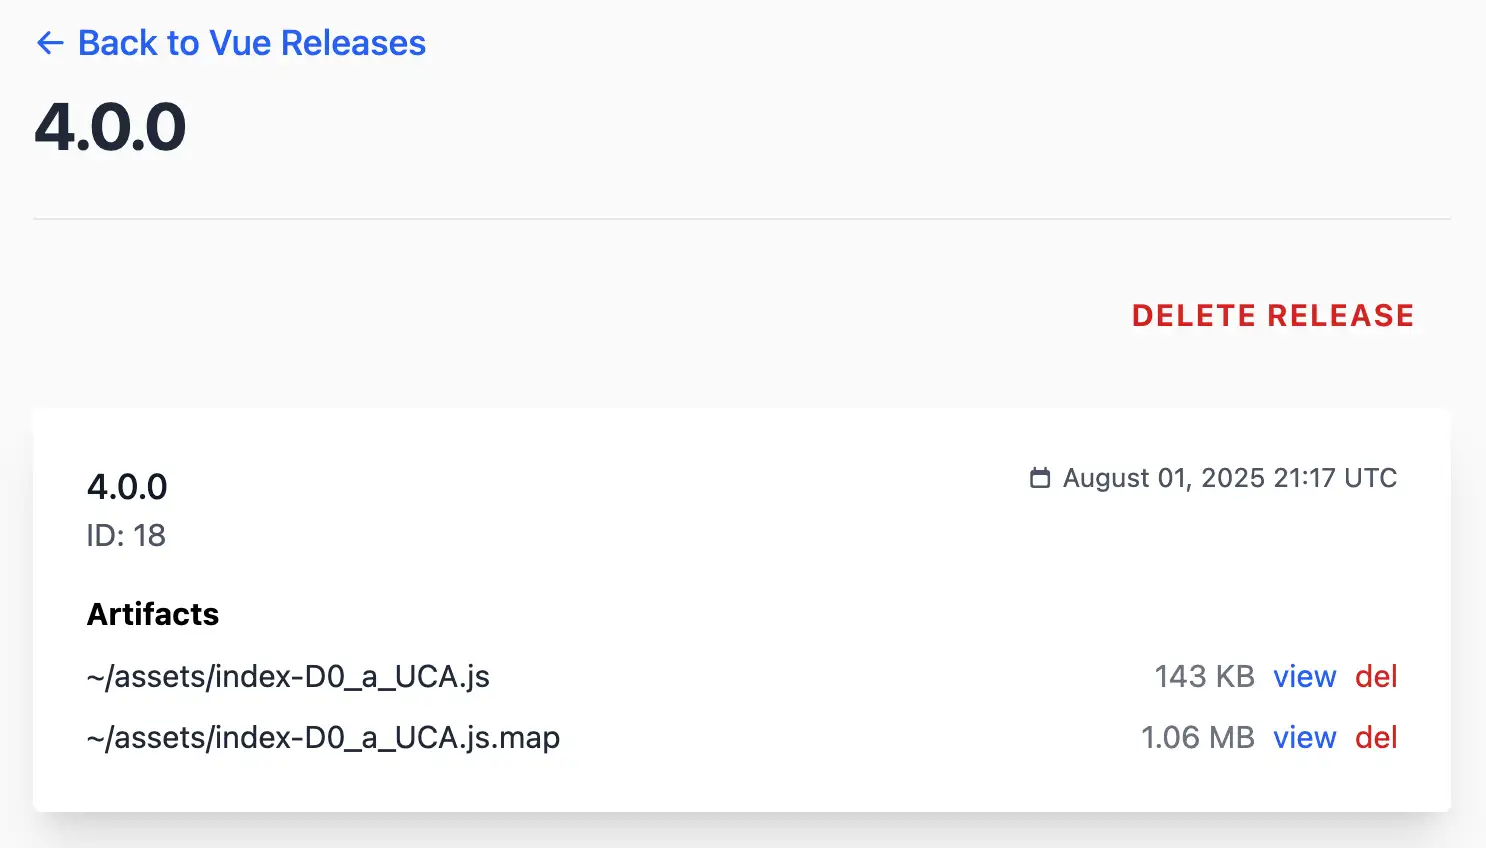
13.4 Release details 
Click a release in the list to view its details. This page shows specifics for that version, including any attached artifacts like source maps.
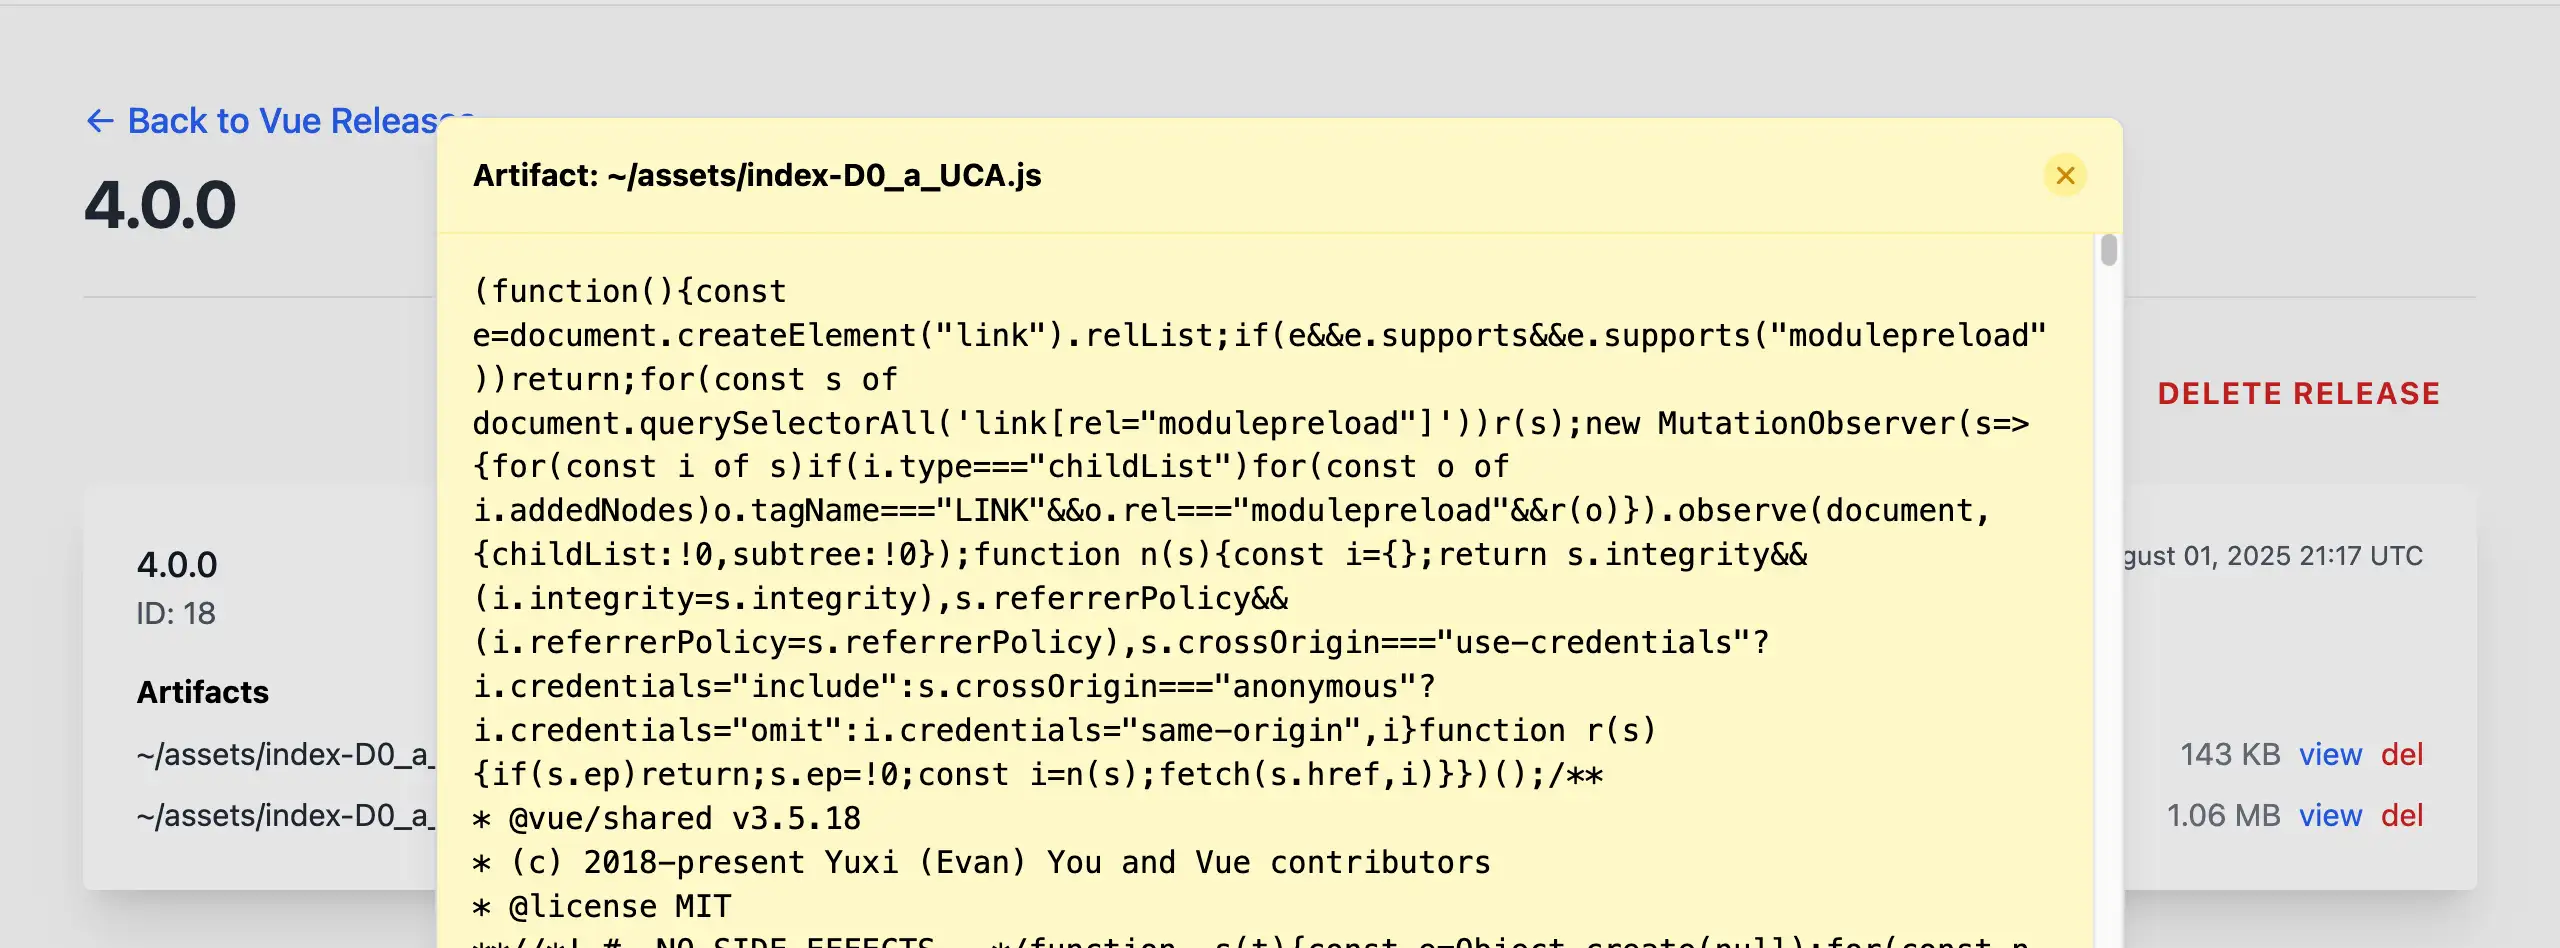
Key actions:
- View attached artifact: Inspect linked source maps for verification.
- Delete attached artifact: Remove source maps if no longer needed or if they were uploaded incorrectly. This won’t delete the release itself, just the mapping.
- Delete release: Remove the release if obsolete — but use caution, as it unlinks source maps and may affect error unminification.
Pro tip: Before deleting, ensure no active errors rely on that version’s mapping. Always test post-deletion.
14 Source maps 
Source maps in Telebugs enable the resolution of minified JavaScript and TypeScript stack traces to their original, readable source code. These maps link production-minified code back to the developer’s original files, facilitating accurate debugging in error reports. This chapter covers the integration of source maps with Telebugs, including creation, uploading, and management within releases.
- Understanding source maps
- Integrating source maps with releases
- Uploading source maps
- Managing source maps
14.1 Understanding source maps 
Source maps are files generated during the build process that associate minified or transpiled code with its original source. They are particularly useful for JavaScript and TypeScript applications using bundlers such as Webpack, Rollup, or Vite, where production code is optimized for size and performance. Without source maps, error stack traces reference the minified code, complicating issue identification. When uploaded to Telebugs and linked to a release, source maps allow automatic unminification, displaying errors with references to the original file, line, and code context.
To generate source maps, enable the appropriate option in your bundler
configuration (e.g., set sourceMap: true).
14.2 Integrating source maps with releases 
In Telebugs, source maps are associated with specific releases (see Releases) to ensure they align with the corresponding application version. This linkage allows Telebugs to apply the correct maps when processing error reports. Access releases via the "Releases (N)" link in the project dashboard (see Individual project view).
Create a release manually, via SDK, or using the Sentry CLI before uploading source maps (see Creating releases).
14.3 Uploading source maps 
Upload source maps to an existing release either manually through the user interface or automatically using the Sentry CLI tool, which is compatible with Telebugs.
- Manual upload: Navigate to the release details (see Release details), select Attach artifacts (or drag and drop), and upload the
.mapfiles. Multiple files can be uploaded simultaneously.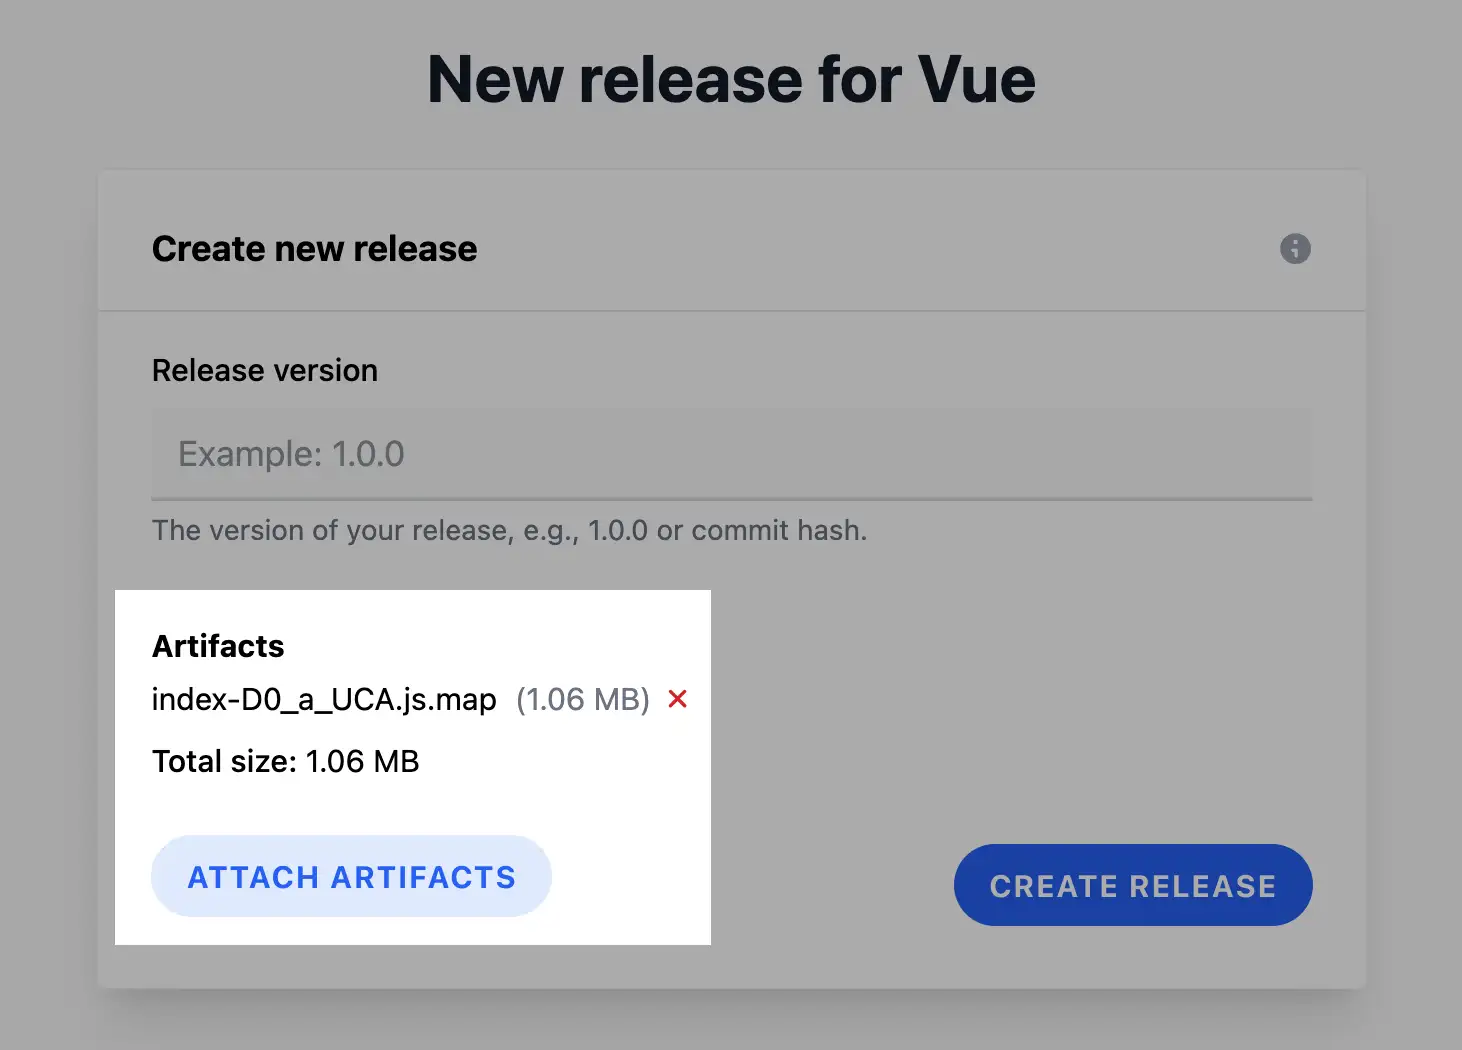
- Automated upload: Obtain an API key from account settings
(see Regenerating your API key). The API key starts with
tlbgs_.
Before running the commands, set the following environment variables:
export SENTRY_URL=<your-telebugs-url>
export SENTRY_AUTH_TOKEN=tlbgs_<your-api-key>
export SENTRY_PROJECT=<your-project-id>
export SENTRY_ORG=<any-value> # This is not used but required for compatibility
Execute the following commands:
sentry-cli sourcemaps upload --release=<version> ./path/to/maps
For builds requiring injection of source map references:
sentry-cli sourcemaps inject ./build
sentry-cli sourcemaps upload --release=<version> ./build
Upon upload, Telebugs applies the maps to incoming error reports, resolving minified traces without further configuration. To verify, trigger a test error and review the resolved stack trace in the report.
14.4 Managing source maps 
Source maps appear as artifacts in the release details page (see Release details). From there, download individual maps for inspection or delete the entire release to remove associated maps. Deletion affects unminification for errors linked to that release, so confirm no active dependencies exist beforehand.
For organization, use descriptive release versions. Apply data retention policies as needed to manage storage (see Data retention), exporting essential data prior to deletion.
15 Error reports 
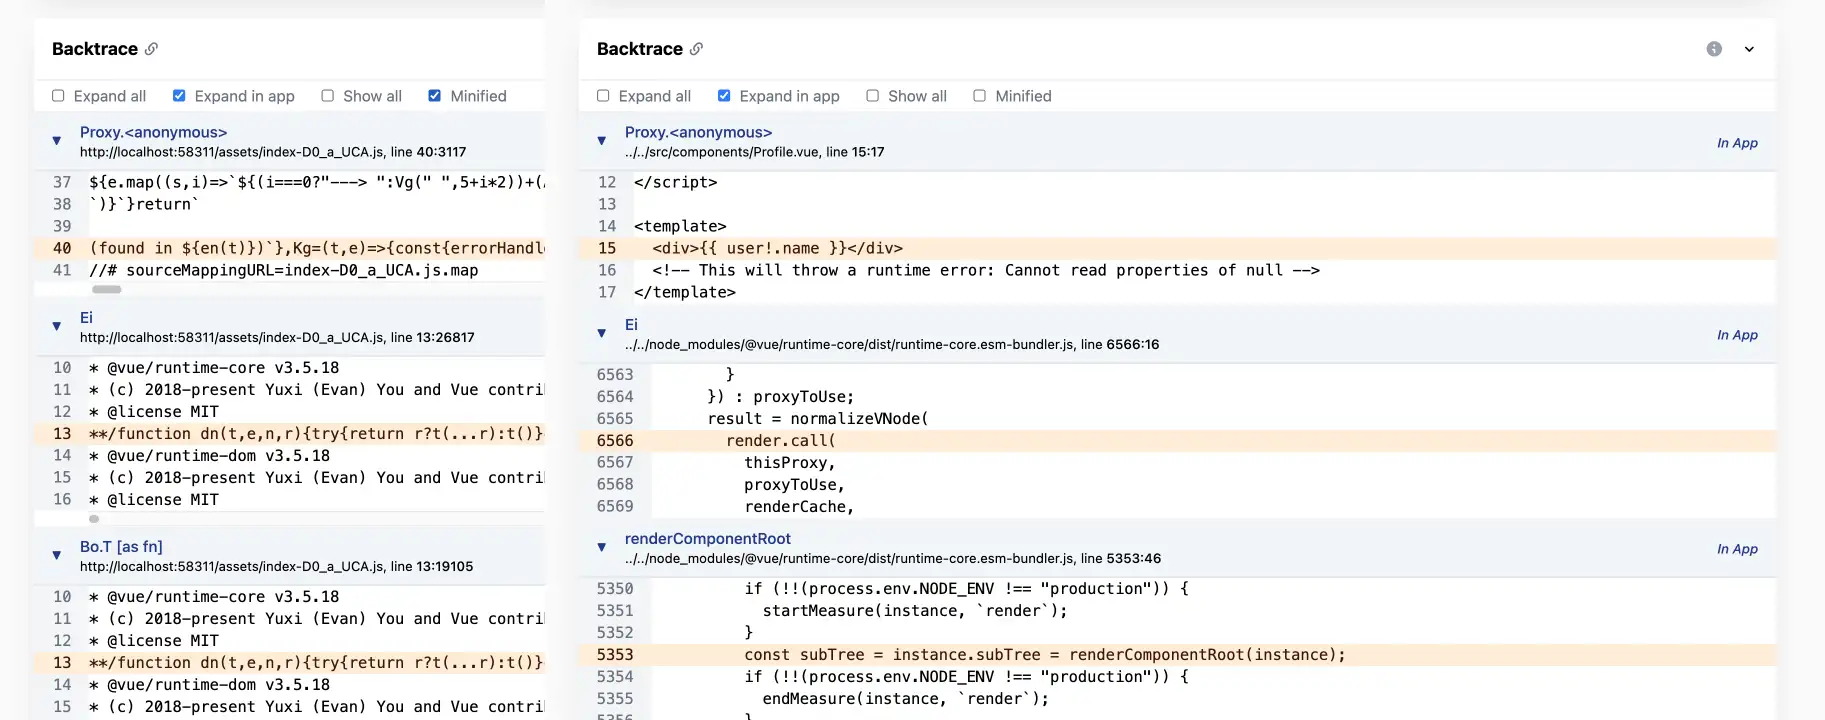
Telebugs collects detailed error reports using Sentry SDKs, providing comprehensive insights into issues occurring in your applications. These reports include various data points to help diagnose and resolve errors efficiently. By capturing structured data such as backtraces, breadcrumbs, and contextual information, Telebugs enables developers to quickly identify the root cause of errors and improve application reliability. In this chapter, we will explore the structure of error reports in Telebugs, how similar errors are grouped, and how to annotate reports with notes for collaboration.
15.1 Error report structure 
Error reports in Telebugs are composed of multiple sections, each offering specific insights into the error event. This structure mirrors Sentry’s event payload model, which includes required fields like event ID and timestamp, as well as optional interfaces for richer context. The following subsections detail each component.
- Report details
- Backtrace
- HTTP Request
- Tags
- Breadcrumbs
- Contexts
- Dependencies
- SDK
- Affected user
- Additional data
15.1.1 Report details 
The Report details section offers a high-level overview to quickly assess the error’s impact and origin, including:
- Error message: The specific message associated with the error, often the primary description of what went wrong.
- When: A human-readable timestamp indicating when the error occurred relative to now (e.g., "5 minutes ago").
- Occurred at: The exact timestamp of the error, formatted in the project’s timezone.
- Handled: Whether the error was handled (caught and reported manually) or uncaught (e.g., an unhandled exception).
- Severity: The severity level of the error (e.g., fatal, error, warning, info, debug), which helps prioritize issues.
- Server name: The name or identifier of the server where the error occurred, useful for distributed systems.
- Environment: The application environment (e.g., production, staging, development)
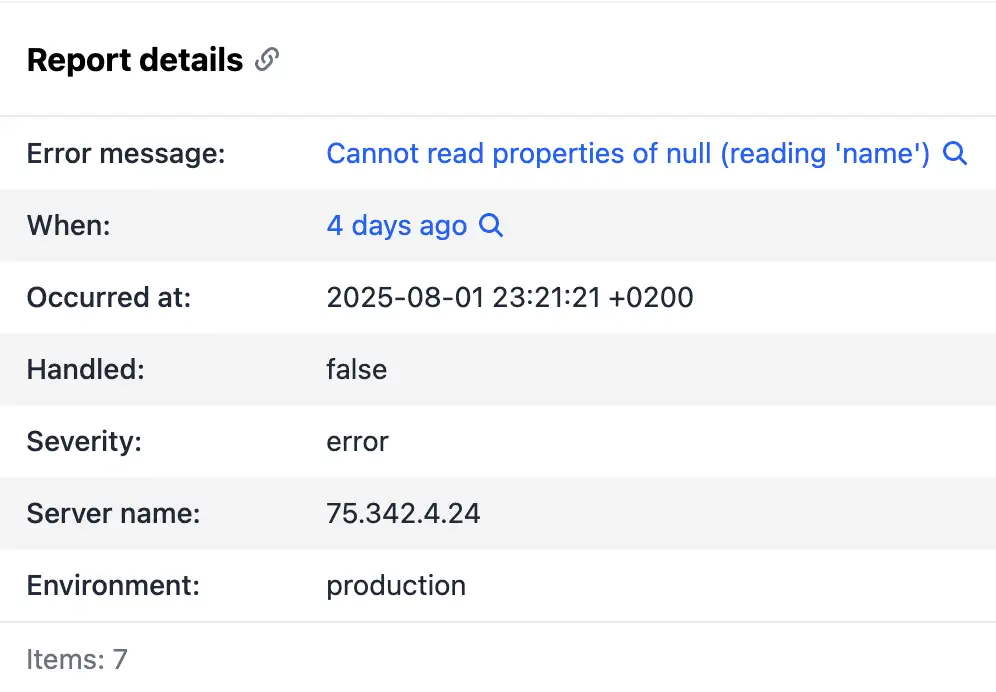
15.1.2 Backtrace 
The Backtrace section displays the backtrace leading to the error, which is crucial for pinpointing the exact location in code where the issue arose. Each frame includes:
- Filename: The file where the code executed.
- Function: The method or function name.
- Line number: The specific line in the file, with optional column number.
Code snippets from the relevant lines are shown, with the error line highlighted in orange for emphasis. If source maps are applied (for minified code), both original and minified views are available. Frames can be expanded to show pre- and post-context lines of code.
This corresponds to Sentry’s exception or threads interface, which
captures the call stack. It supports features like "in-app" frames to
distinguish application code from dependencies.
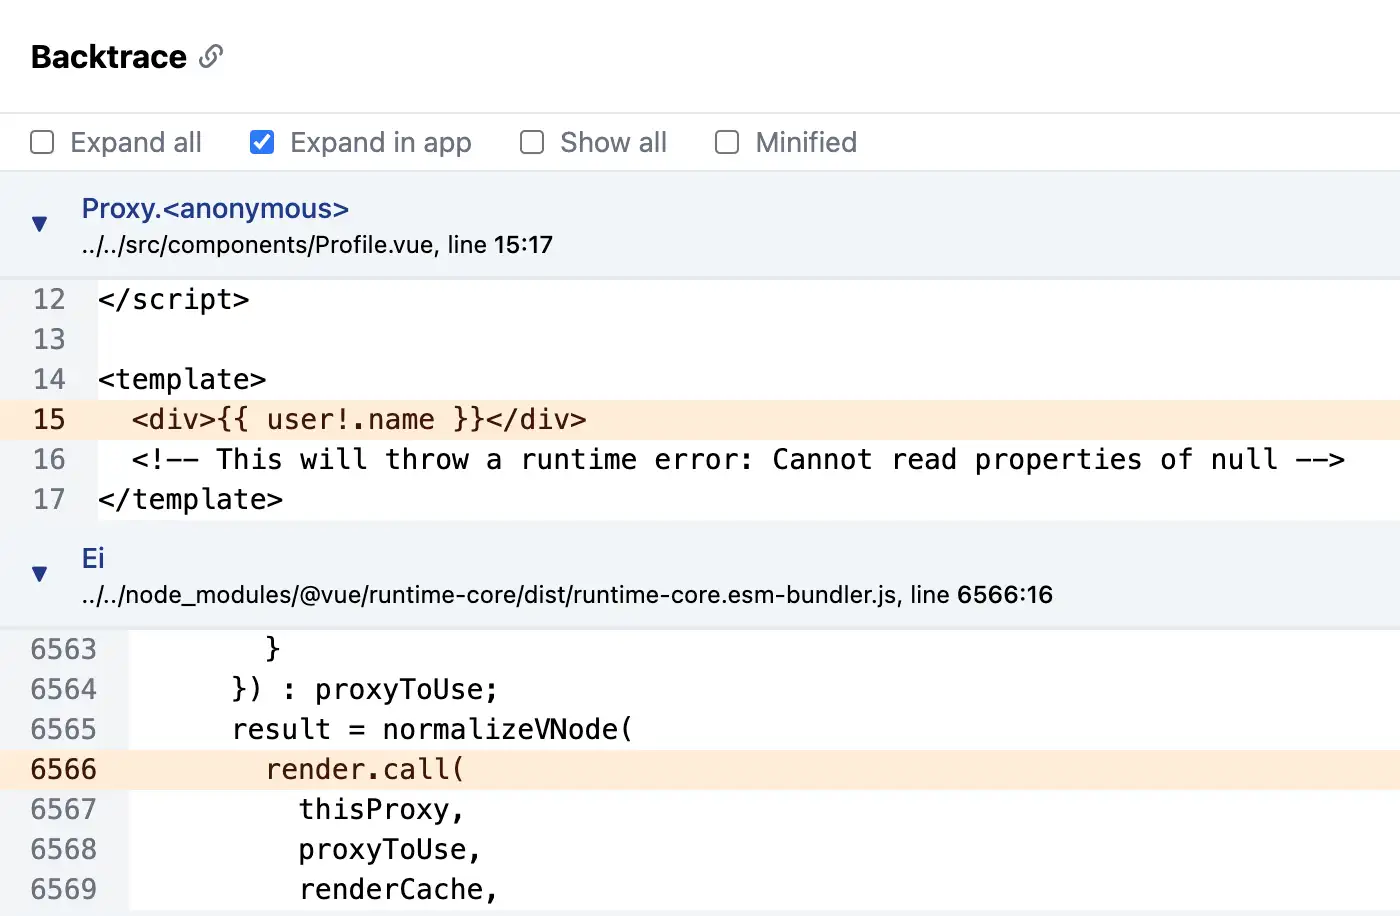
To verify, expand frames and check if the highlighted line matches the error description.
15.1.3 HTTP Request 
For web applications, the HTTP Request section captures request details, providing context about the network interaction that led to the error:
- Method: HTTP method (e.g., GET, POST).
- URL: The requested URL, including query parameters if present.
- Request headers: All headers sent with the request, such as User-Agent or Content-Type.
- Request env: Additional environment variables, like remote address or server protocol.
- Request data: Any body data, such as form parameters or JSON payload (if captured).
This section maps to Sentry’s request interface, which helps reproduce
errors by showing the exact request state. It’s particularly useful for
debugging API or web-related issues.
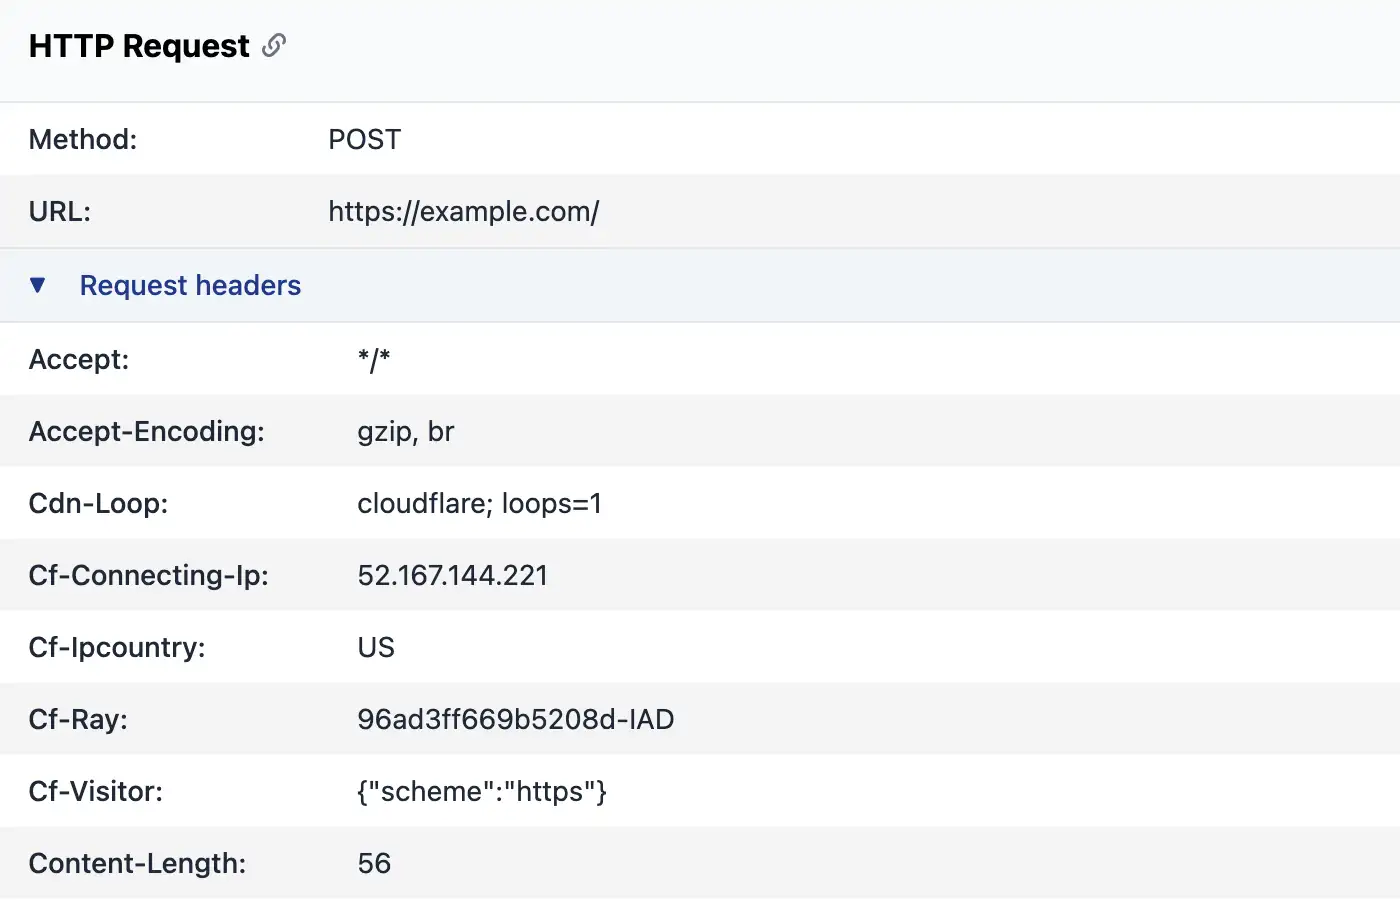
15.1.4 Tags 
Tags are key-value pairs providing additional context, such as request
IDs, custom labels, or system metrics (e.g., "browser: Chrome", "os: Windows").
In Telebugs, tags appear in a table format and can be used for filtering and
searching error reports. This aligns with Sentry’s tags interface,
enabling categorization and quick querying across events.
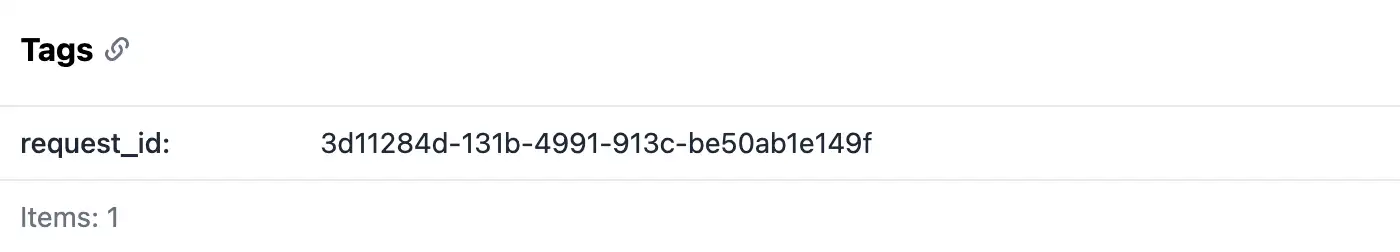
Add tags via the SDK to enhance searchability, e.g.,
Telebugs.setTag('user_role', 'admin').
15.1.5 Breadcrumbs 
Breadcrumbs are chronological events leading up to the error, forming a timeline of actions. Each breadcrumb includes:
- Timestamp: When the event occurred.
- Category: Type of breadcrumb (e.g., console, http, navigation).
- Message: Descriptive text.
- Data: Additional payload, such as URL for HTTP requests.
- Level: Severity, if applicable.
Breadcrumbs can be expanded to view detailed data in JSON format. This section
corresponds to Sentry’s breadcrumbs interface, which records events like
log statements, UI interactions, or network calls, aiding in reconstructing the
error sequence.
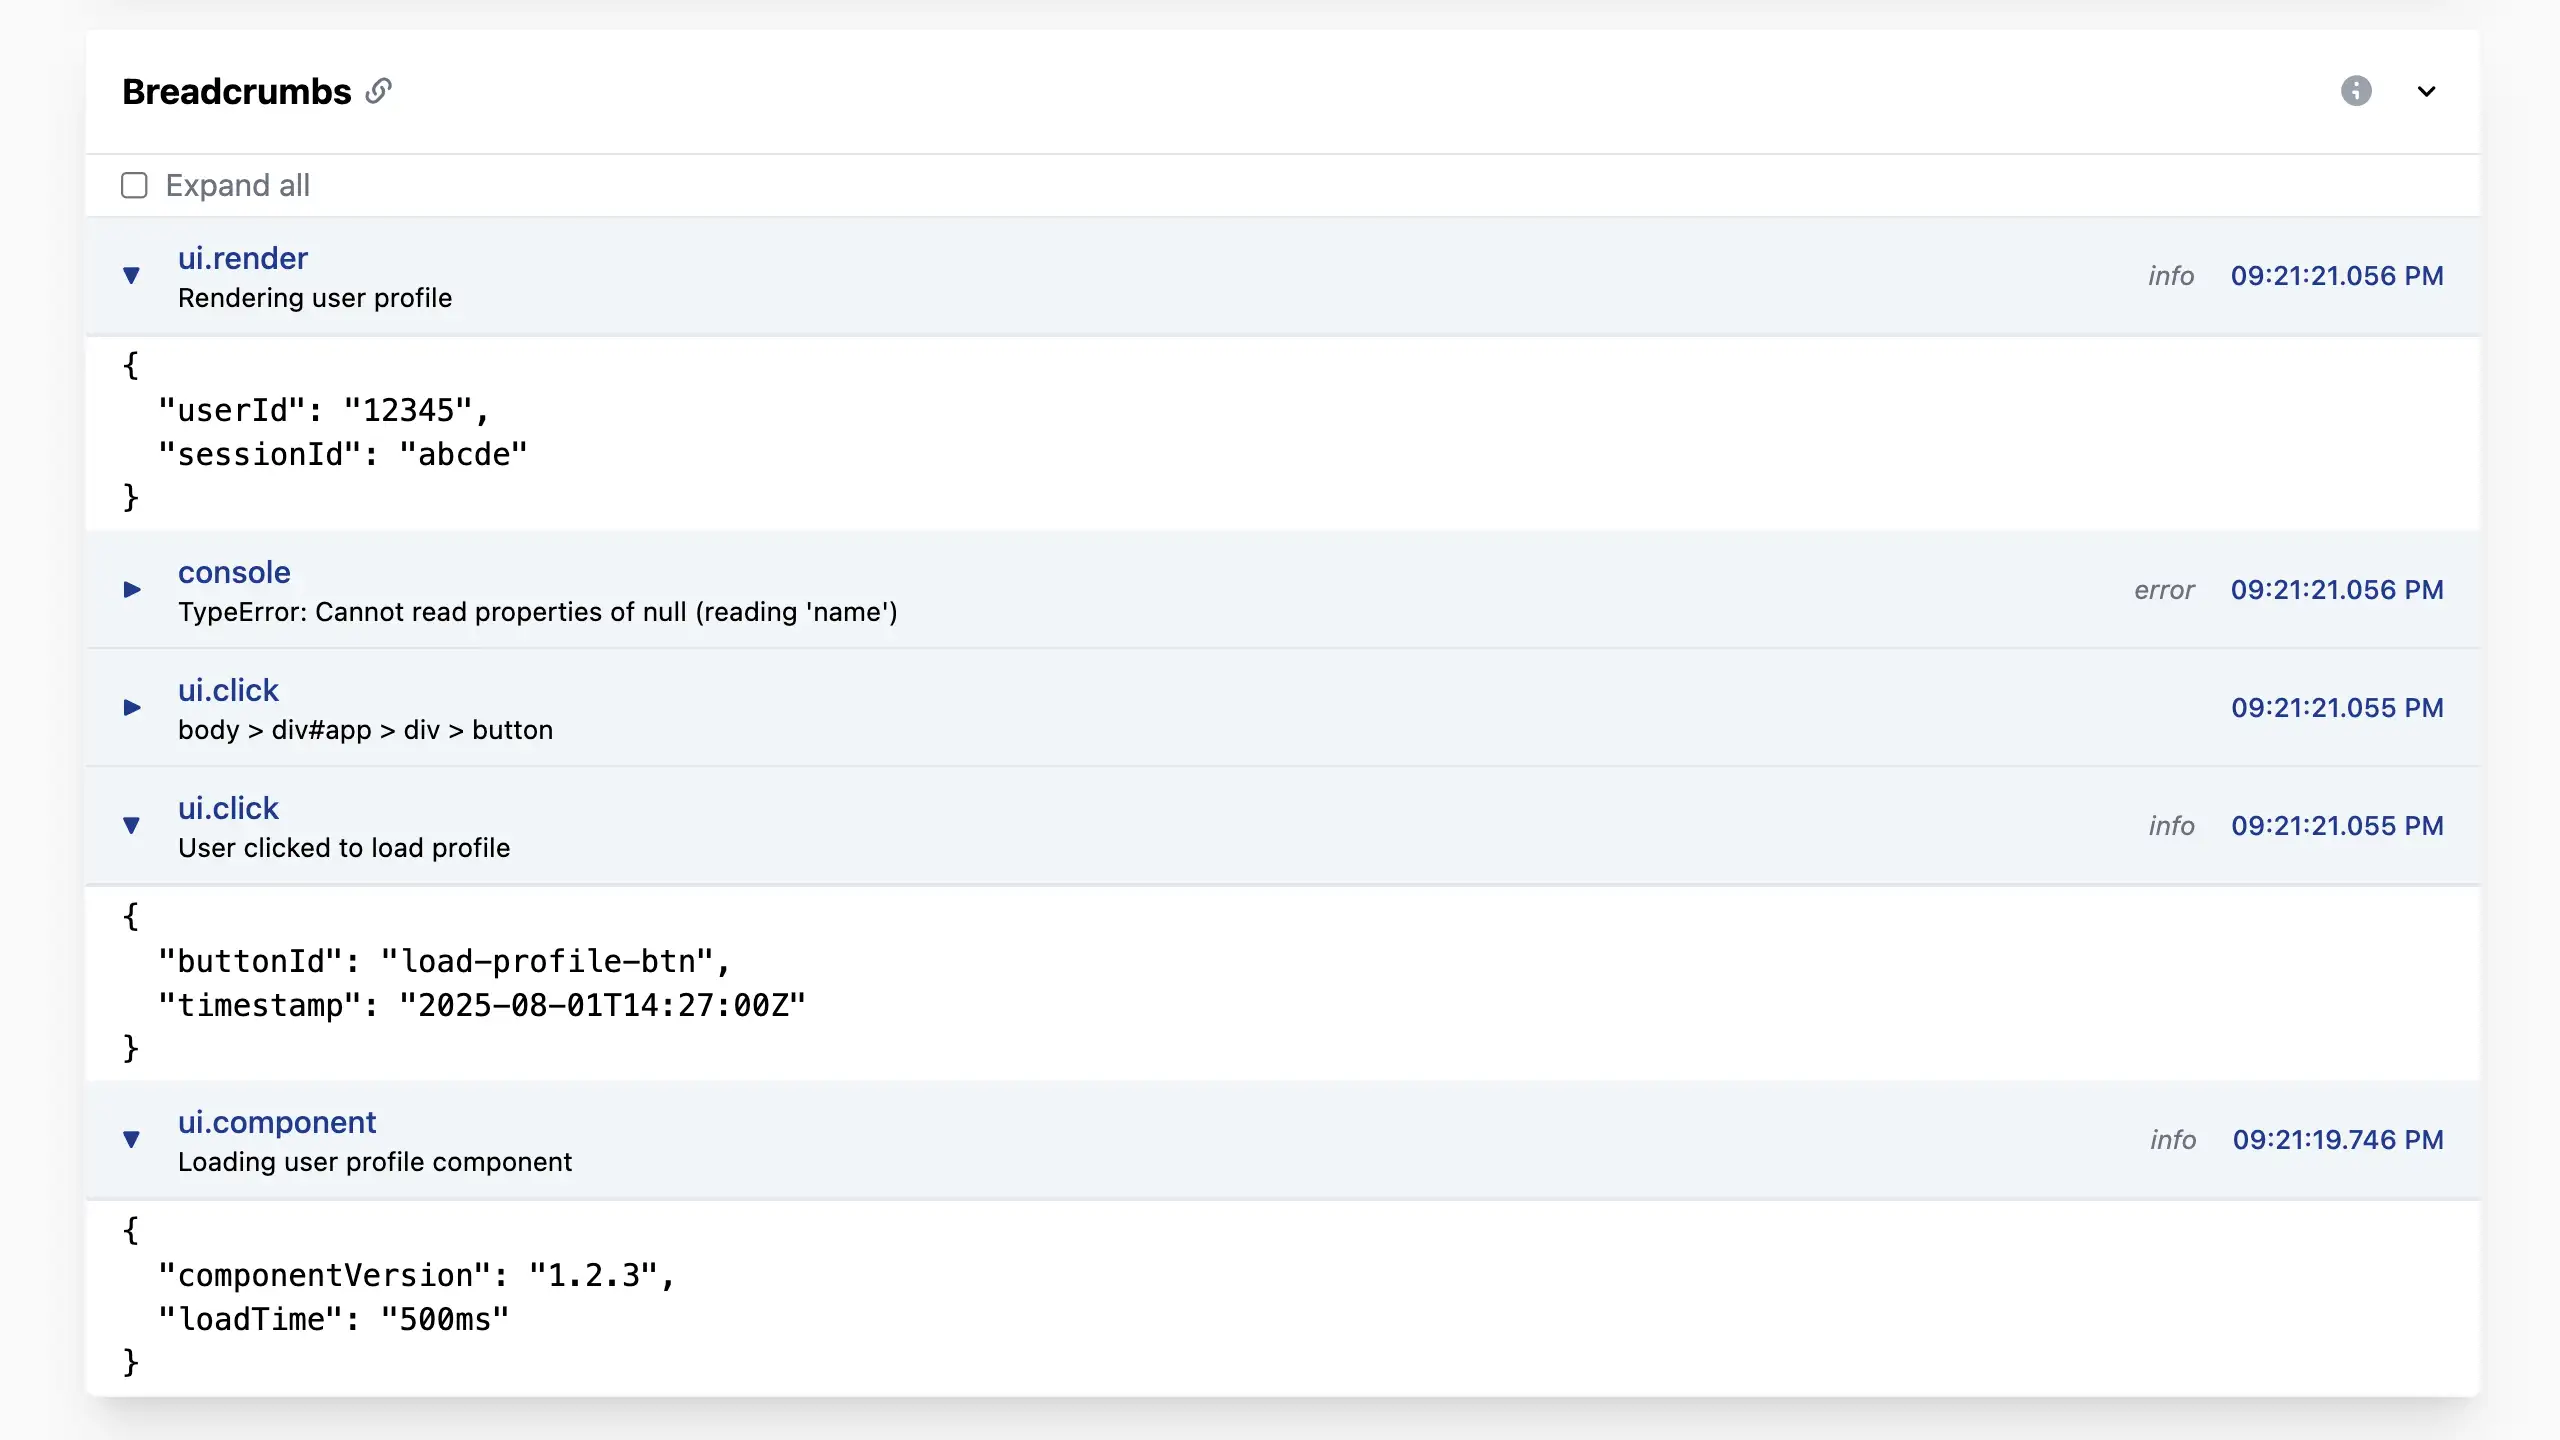
Configure the SDK to automatically capture breadcrumbs for better diagnostic trails.
15.1.6 Contexts 
Contexts provide environmental information about the runtime and system:
- OS: Operating system details, including name and version.
- Runtime: Runtime environment (e.g., Node.js version, Python interpreter).
- Trace: Tracing information like trace ID and span ID for distributed tracing.
- Device: Hardware details, such as model or battery level.
- Browser: Browser-specific data, if applicable.
Displayed in a table, this maps to Sentry’s contexts interface, offering
multi-faceted context (e.g., app, device, GPU) to understand the error’s
surroundings.
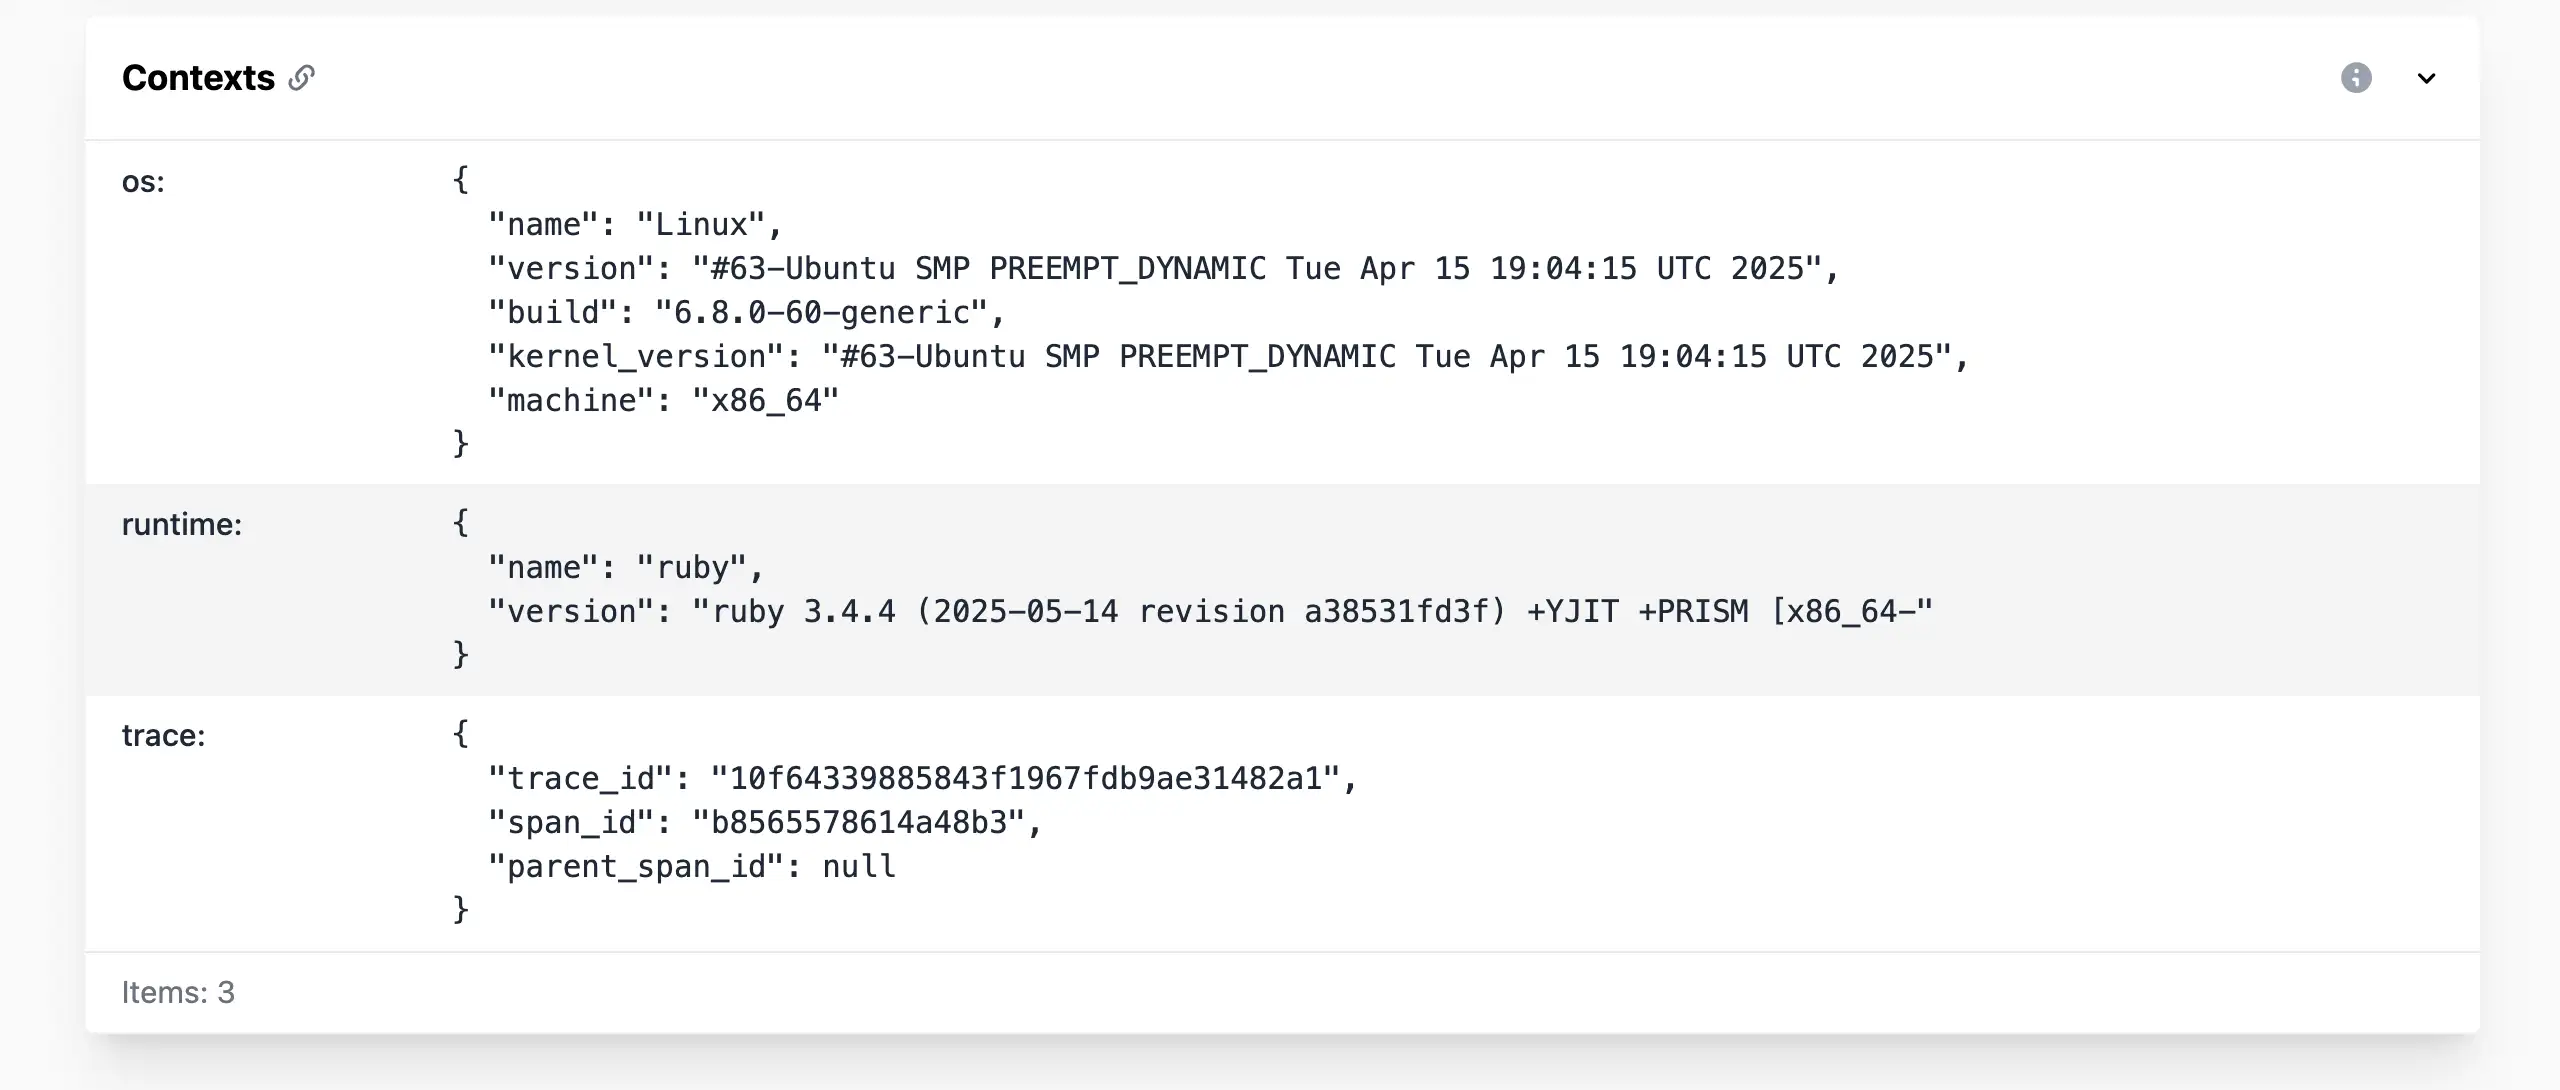
15.1.7 Dependencies 
The Dependencies section lists all loaded modules or packages with
their versions (e.g., "express: 4.17.1"). This corresponds to Sentry’s
modules attribute, helping identify if a specific library version is
causing issues.
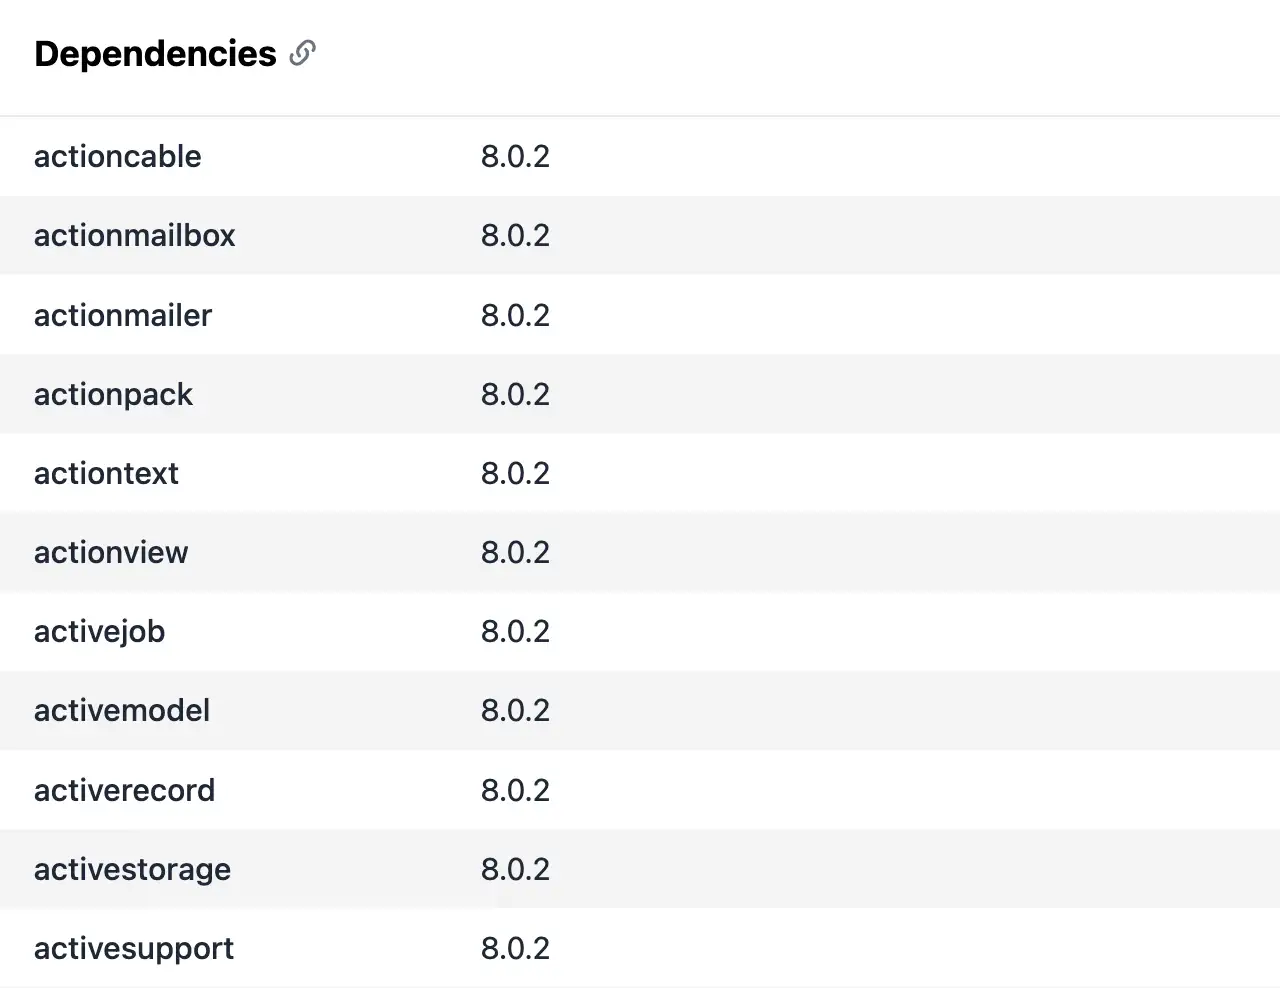
Review this for potential compatibility problems or outdated libraries.
15.1.8 SDK 
The SDK section identifies the Sentry SDK used, including name (e.g.,
"sentry-javascript") and version. This aligns with Sentry’s sdk
interface, which includes details like integrations and packages, ensuring
compatibility and tracing SDK-related anomalies.
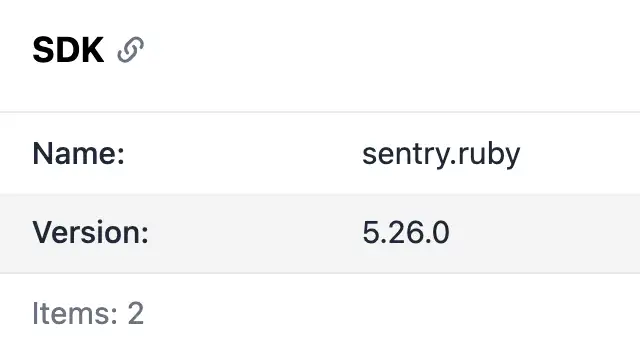
15.1.9 Affected user 
The Affected user section captures information about the user impacted by the error:
- User ID: Unique identifier.
- Username: Display name.
- Email: Contact email.
- IP address: User’s IP.
- Geo location: City, region, country (derived from IP).
Additional user data can be included in an extra data subsection. This maps to
Sentry’s user interface, aiding in user-specific debugging and
personalization.
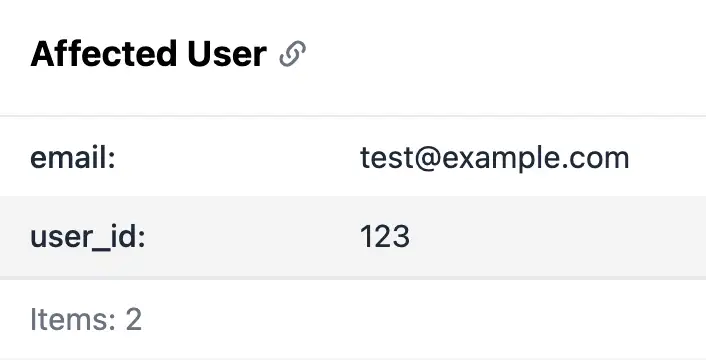
Set user context via the SDK, e.g., Telebugs.setUser({ id: '123', email: '[email protected]' }).
15.1.10 Additional data 
The Additional data section holds arbitrary key-value pairs for custom
metadata (e.g., session variables or debug info). This corresponds to Sentry’s
extra interface, allowing flexible extension of event data.
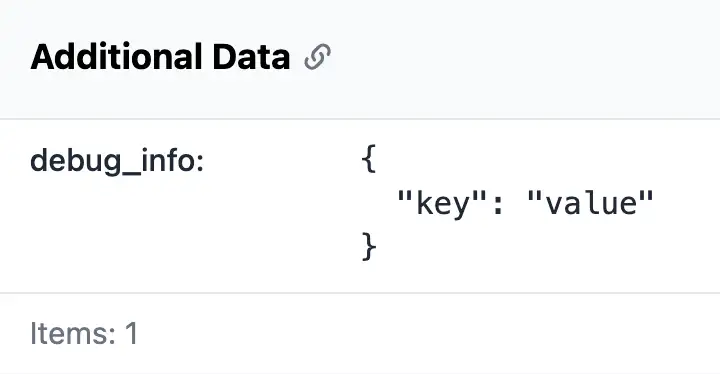
Use this for application-specific details not covered by other sections.
15.2 Grouping rules 
Grouping rules determine how similar errors are grouped together in Telebugs. This helps reduce noise and makes it easier to focus on unique issues. Telebugs uses a fingerprinting mechanism similar to Sentry’s, where events with matching fingerprints (e.g., based on backtrace or custom rules) are aggregated into a single issue.
In Telebugs, the grouping process starts by checking for a custom fingerprint
provided via the SDK. If present, it computes the fingerprint by hashing the
custom value (or joined array values separated by "|"). If no custom fingerprint
is set, Telebugs generates a default fingerprint by hashing a "group string"
derived from the event data in this order of priority:
- Backtrace (stack trace): If a stack trace is available in exceptions or threads, the group string is built from relevant frames, preferring "in-app" frames (application code) over system frames. For each frame, it concatenates the filename, function name, and line number. This ensures errors with similar application code paths are grouped, ignoring unrelated differences.
- Exception: If no stack trace exists but exception data is present, the group string combines the exception type (e.g., "TypeError") and value (e.g., "Cannot read property ’x’ of undefined").
- Message: As a fallback, it uses the log entry message or formatted message, grouping based on the error description.
This hierarchical approach mirrors Sentry’s default strategies, focusing on stack traces for precision, falling back to exceptions or messages when needed. For example, two exceptions with identical application stack traces but different system frames would share the same fingerprint and group together.
Grouping details, accessible via a square stack icon in error reports, show the
fingerprint (e.g., a hash like 7bcb86ee6ce64c0a8d0f37fde2ff18c), method
(e.g., "backtrace"), specific frames, message, and merged errors.
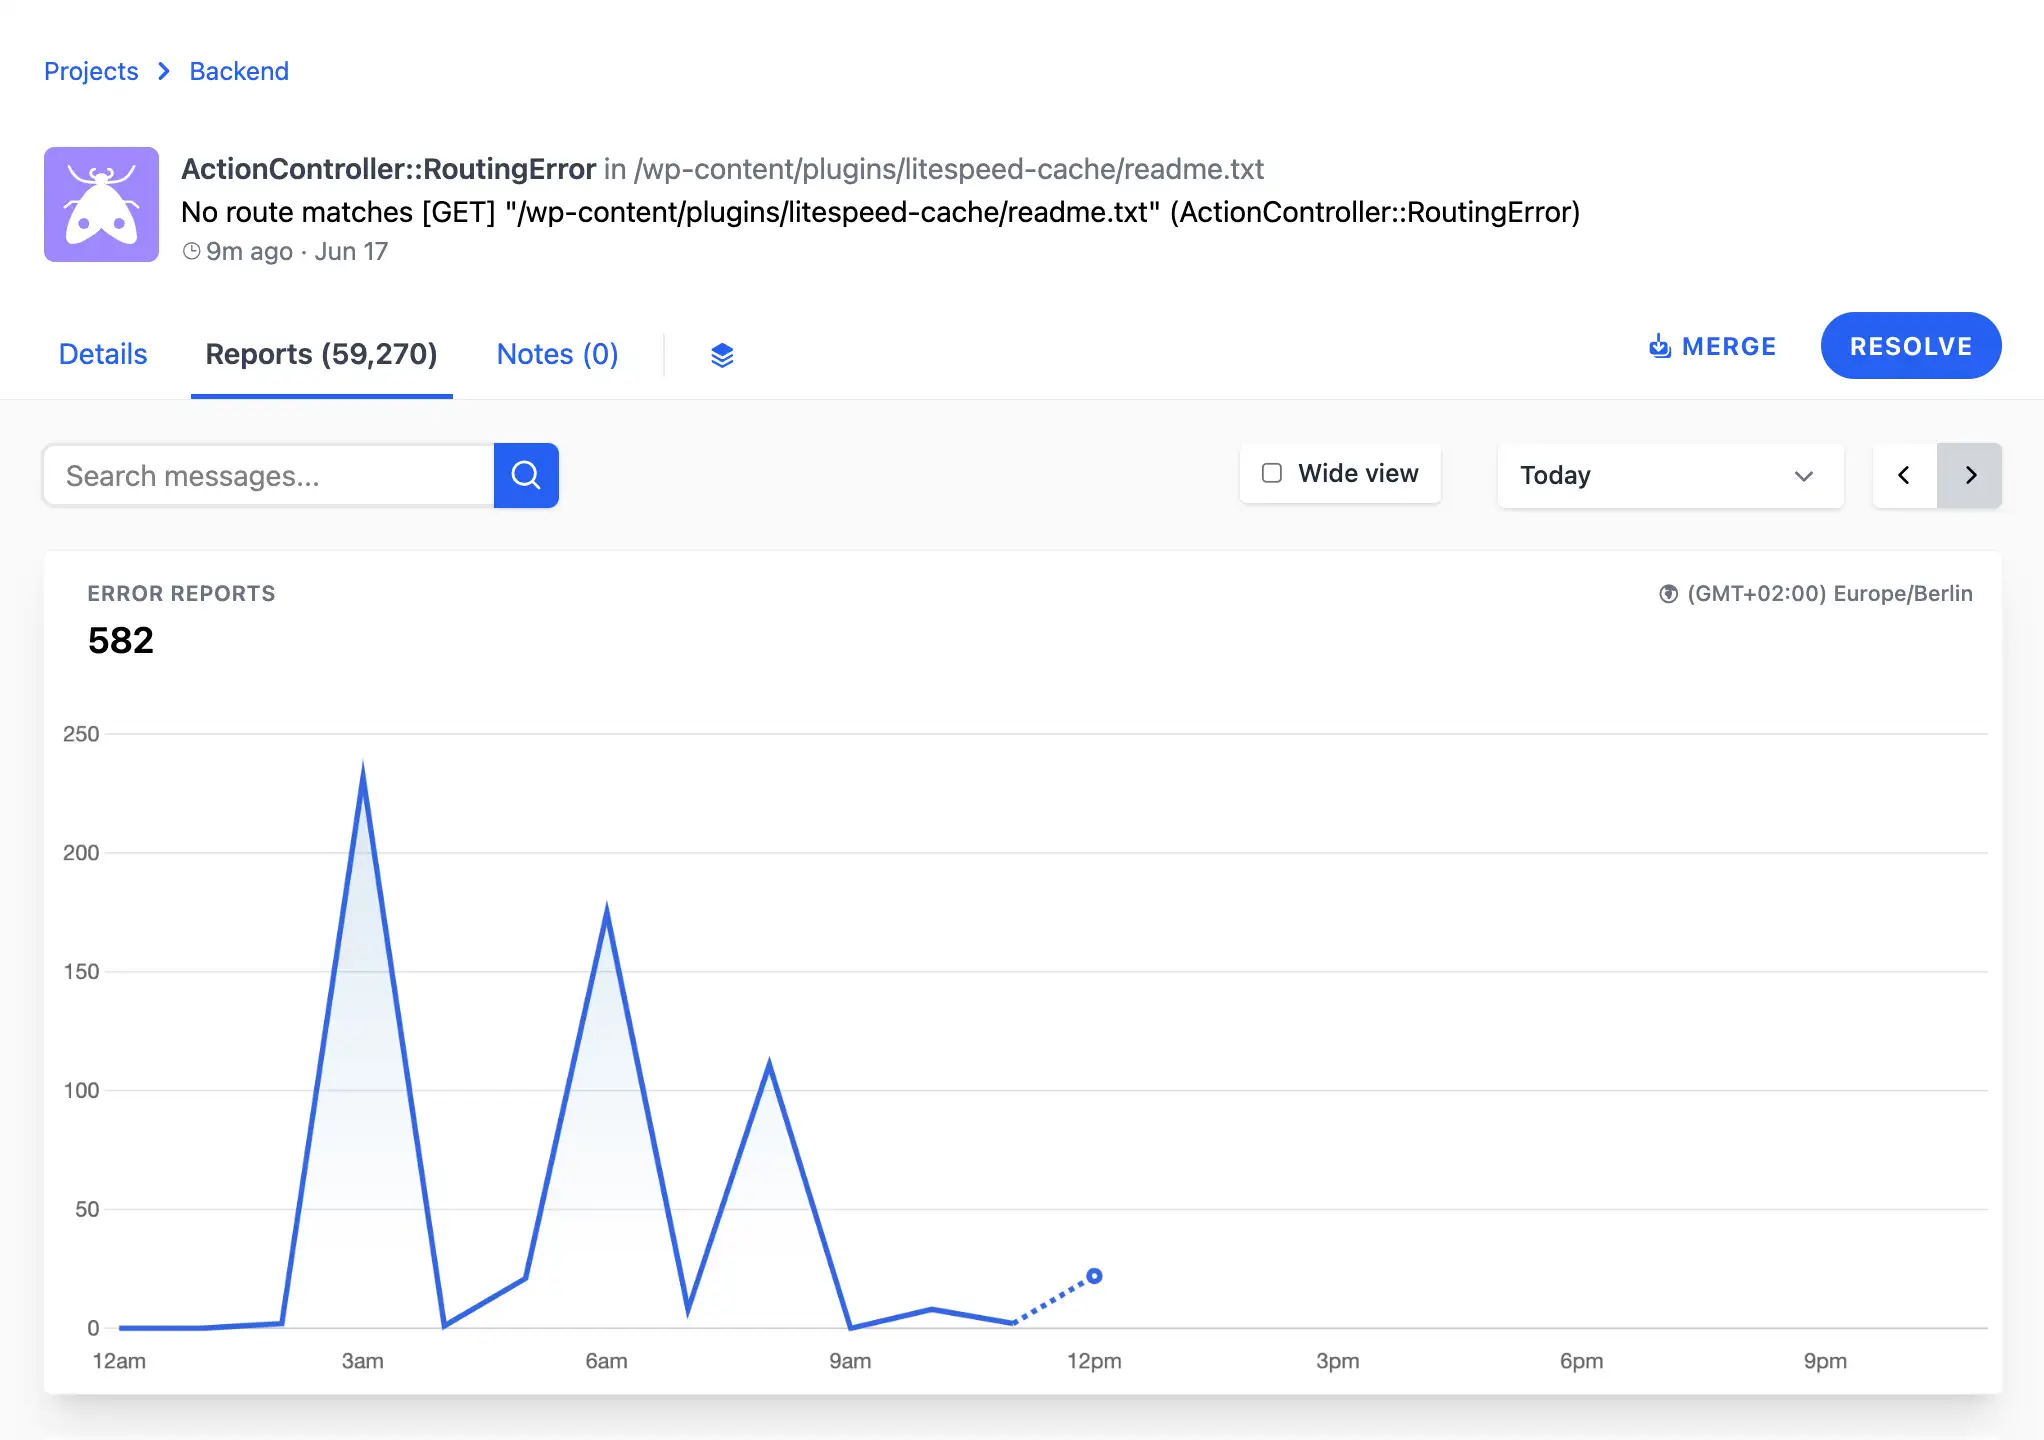
15.2.1 Custom fingerprinting 
Custom fingerprinting allows you to control how errors are grouped by providing
a list of strings when reporting an error. Errors sharing the same fingerprint
are grouped together, overriding default grouping. By default, Telebugs might
group errors separately if they contain unique details, such as different order
numbers in error messages (e.g., Payment failed for order 123 and
Payment failed for order 456). With custom fingerprinting, users can
group such errors together.
For example, to group payment failure errors regardless of order IDs:
begin
  # Some code that might fail
rescue StandardError => e
  Sentry.capture_exception(e, fingerprint: ["payment-failure"])
end
In this example, setting ["payment-failure"] as the fingerprint ensures
all errors with this fingerprint are grouped into one, making it easier to track
payment-related issues collectively.
For dynamic grouping by user action (e.g., "checkout" or "login"):
begin
  # Some code that might fail
rescue StandardError => e
  action = "checkout"  # From app context
  Sentry.capture_exception(e, fingerprint: ["error", action])
end
This creates separate groups for each action type, such as ["error",
"checkout"] for checkout errors and ["error", "login"] for login errors,
providing a clearer picture of where problems occur.
This aligns with Sentry’s fingerprinting, enabling flexible organization by features or error types.
15.2.2 Manual group merging 
Telebugs allows manual group merging to combine similar errors that end up in separate groups due to minor differences, keeping error tracking organized. Once merged, future reports matching either original group are directed to the new combined group. This action is irreversible, so users are advised to double-check the URLs before confirming.
Steps for manual group merging:
- Navigate to the error group you want to keep as the main one.
- Click the Merge button.
- A dialog opens with the text "Merge errors dialog".
- Enter the URLs of the error groups you want to merge into the main group.
- Press
Merge Errorsto confirm.
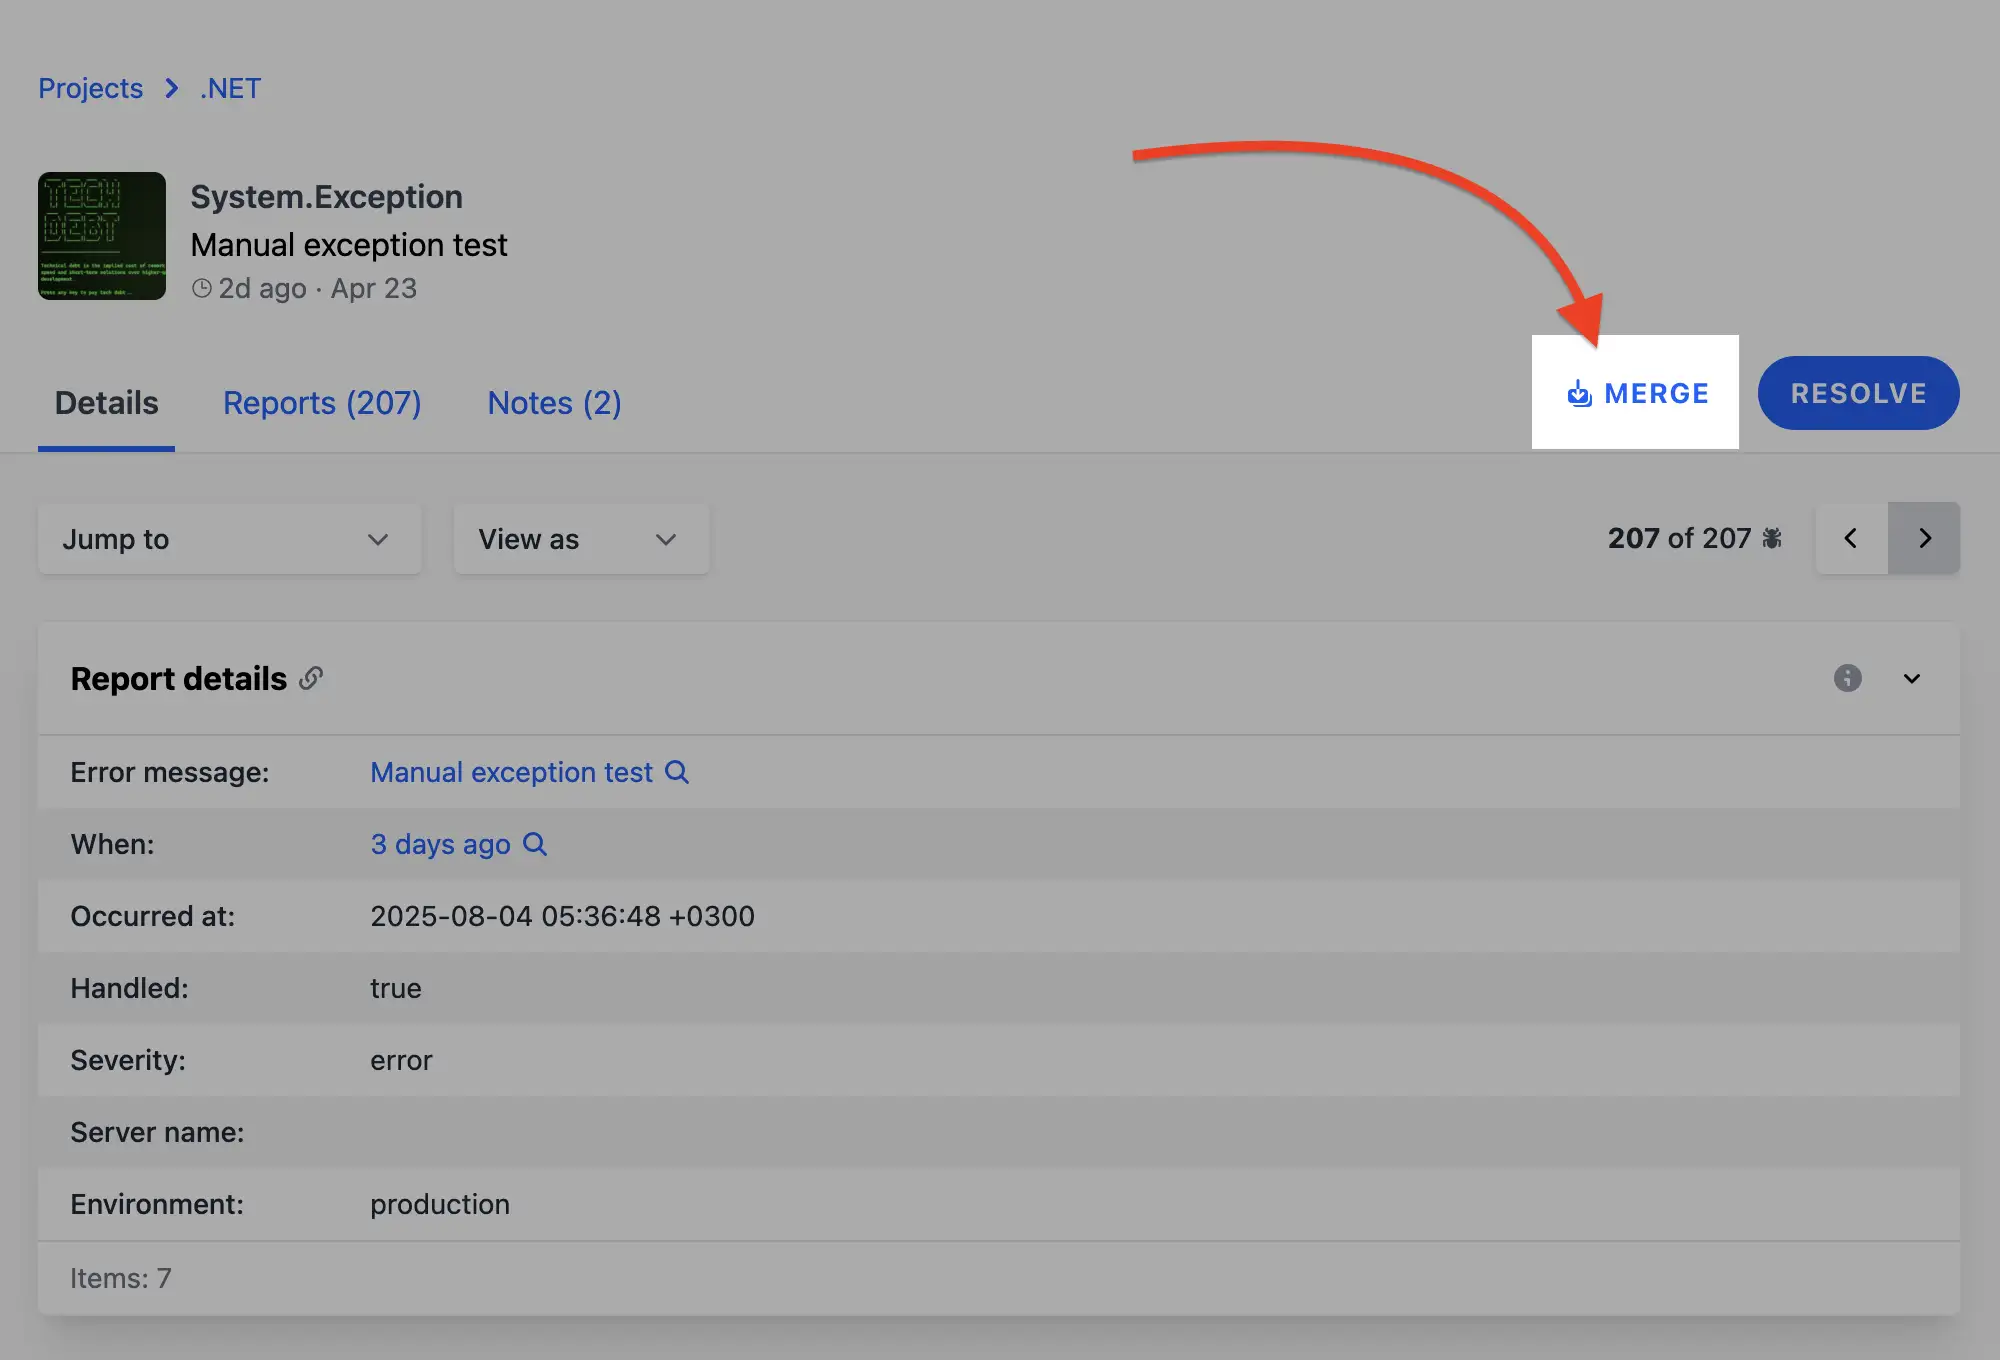
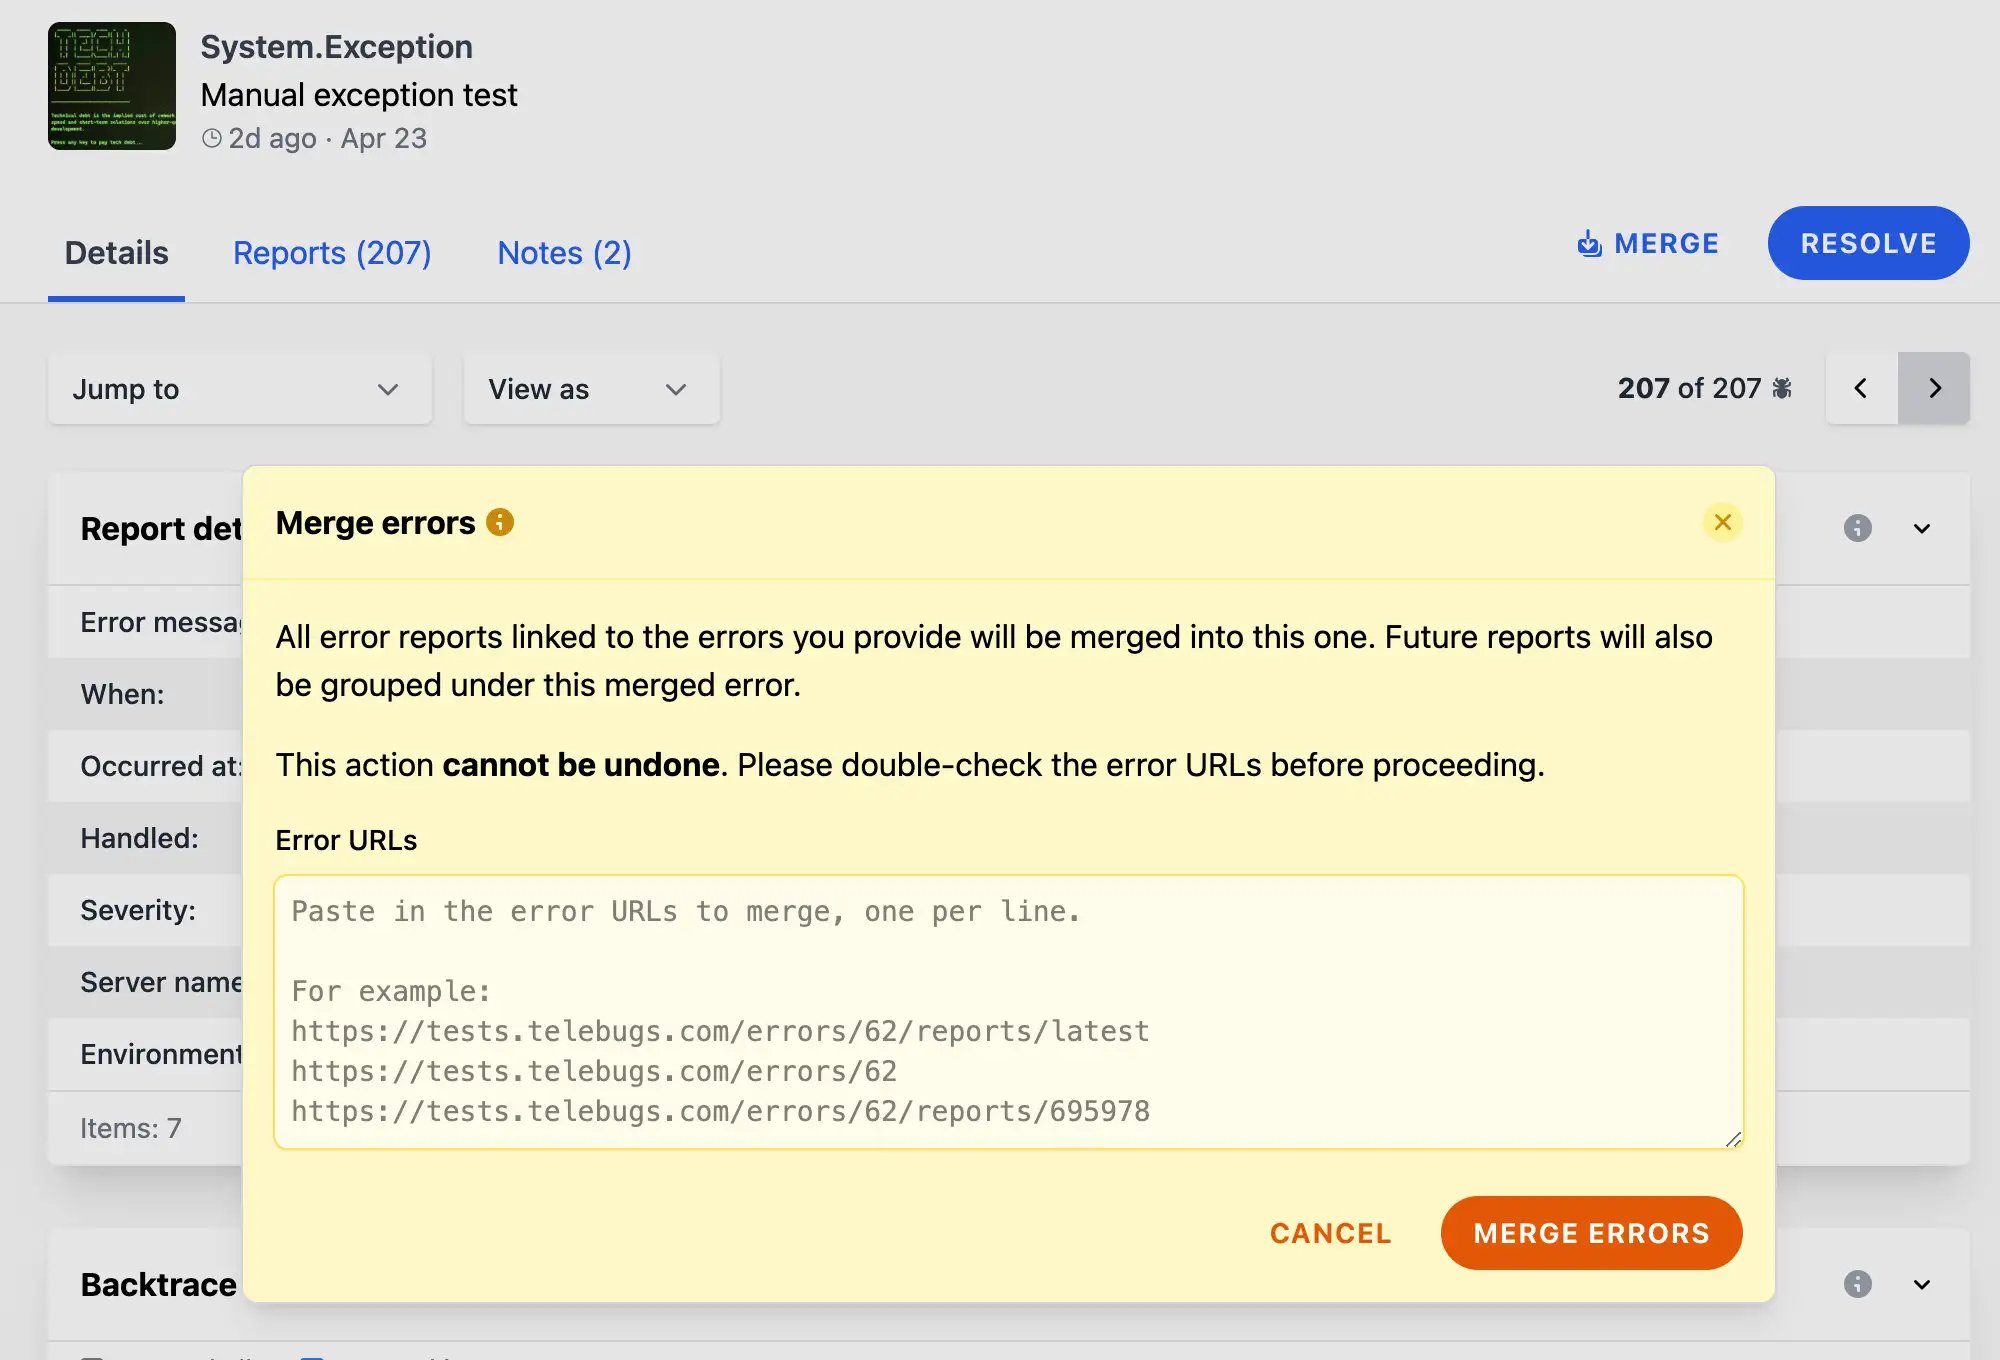
For instance, if there are two groups for Database Connection Failed — one
with a timeout message and another with a retry failure — they can be merged
into a single group for easier management.
15.2.3 Grouping details visibility 
Telebugs adds grouping details to error reports, enabling users to see why an error was grouped in a particular way, including the fingerprint used. This feature enhances transparency and helps verify or adjust grouping logic.
When viewing an error report, a new button resembling a "square stack" is available. Clicking this button reveals the grouping details, which include:
- Fingerprint: A unique MD5 hash identifier for the error group, e.g.,
7bcb86ee6ce64c0a8d0f37fde2ff18c. - Method: The grouping method used, such as “custom” (for SDK-provided fingerprints), “backtrace” (stack trace-based), “exception” (type and value), or “message” (error message).
- Frames: For backtrace method, lists specific stack frames used for grouping, including filename, function, and line number—focusing on in-app frames if available.
- Message: For message method, the error message that determined the grouping.
- Merged errors: Details of other groups merged into this one, including their fingerprints.
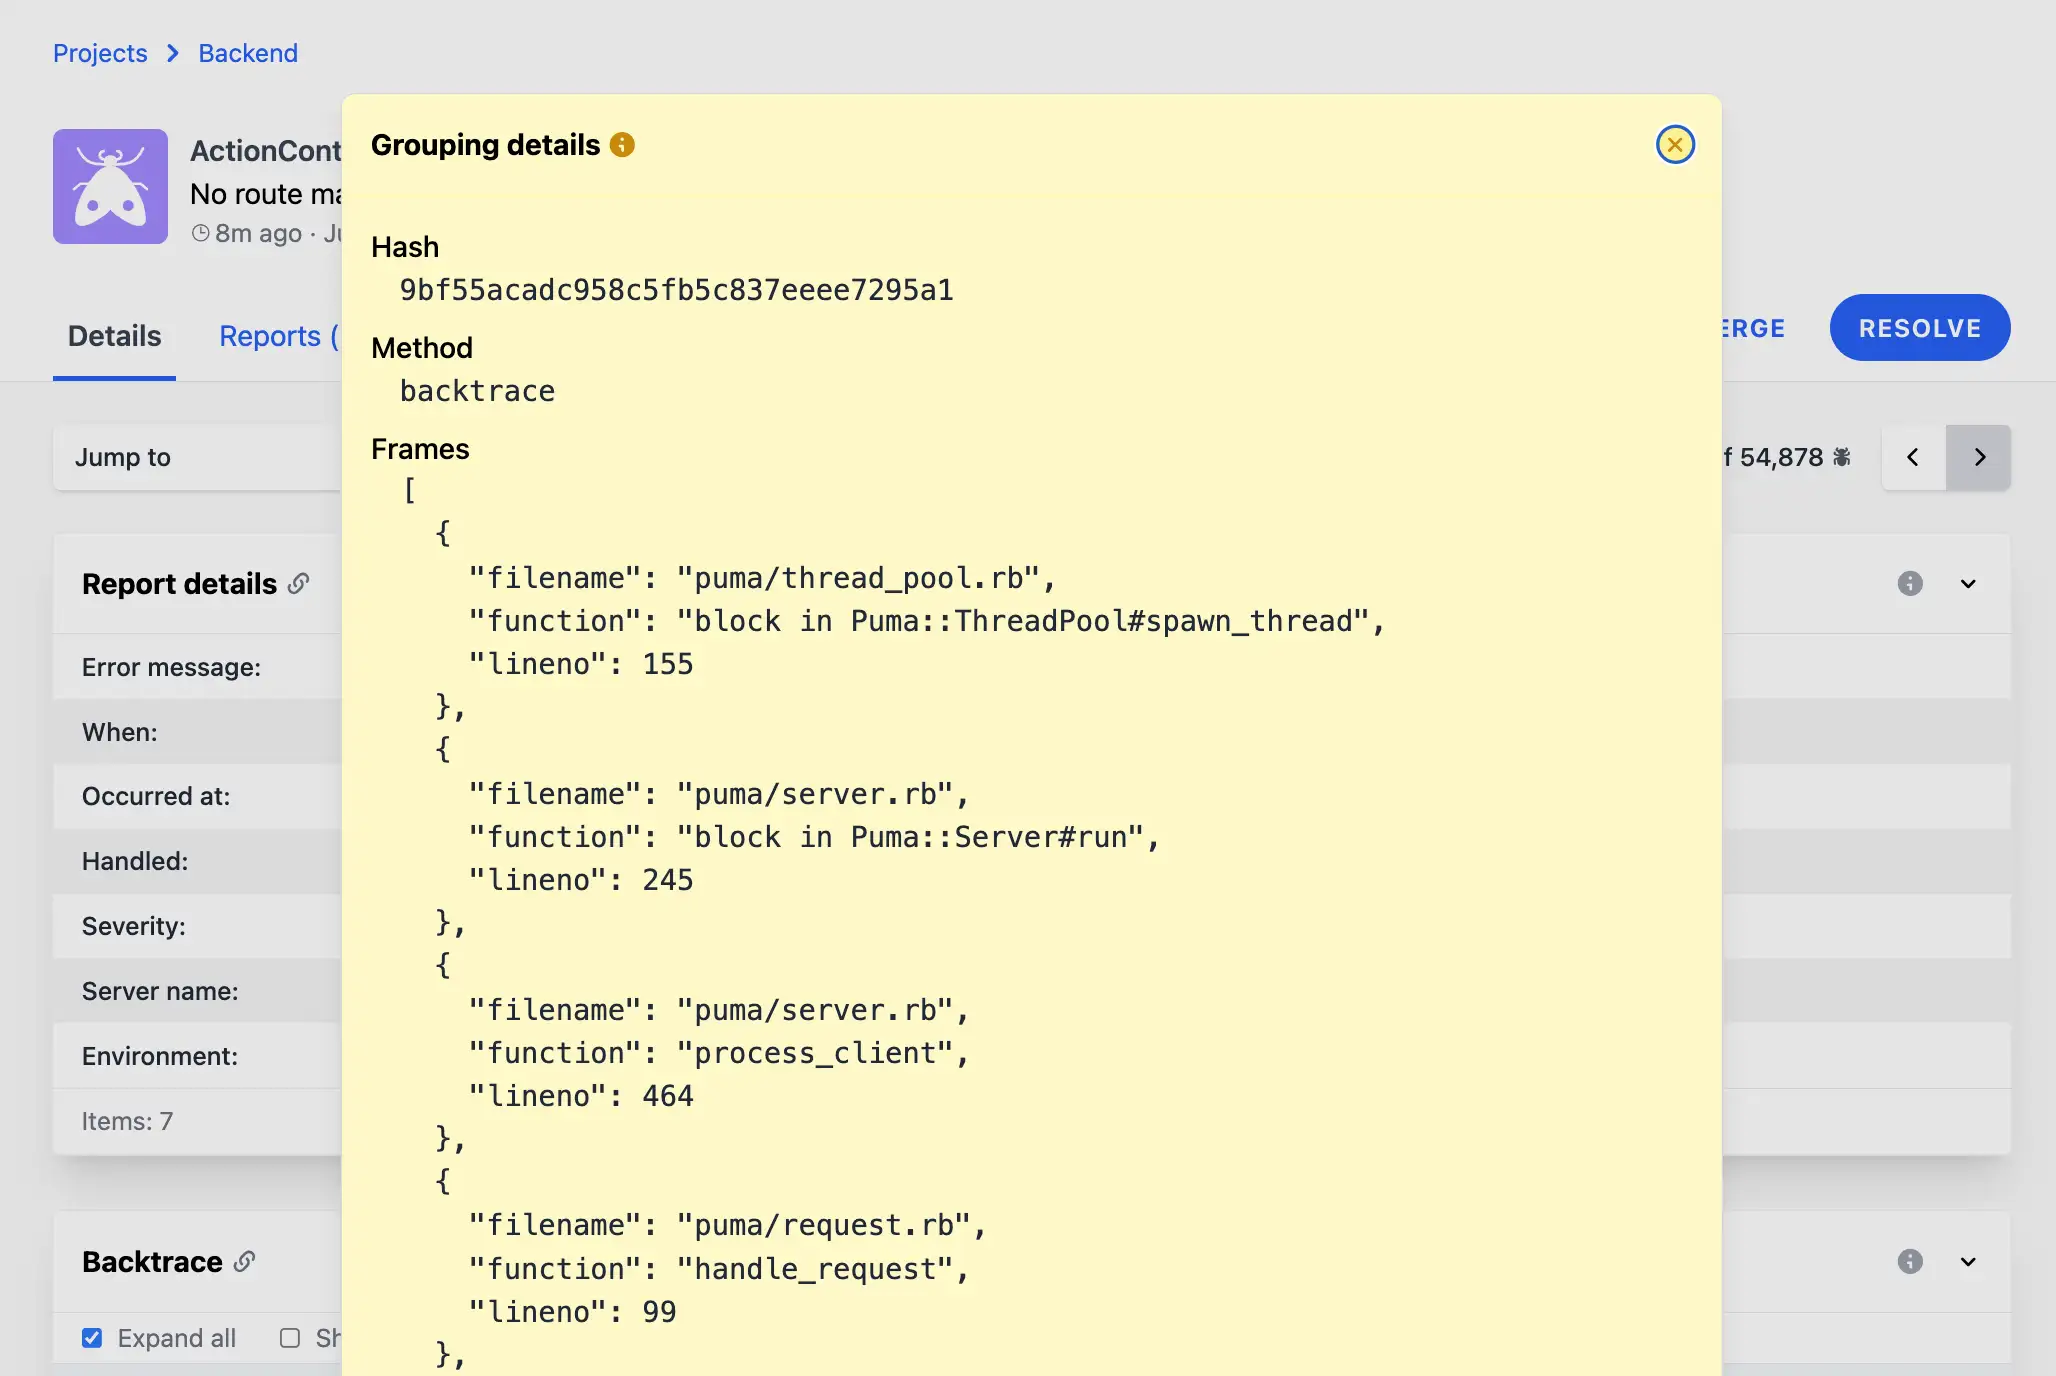
This visibility helps pinpoint grouping issues, debug why certain errors are separated (e.g., due to differing stack frames or messages), and ensures accurate error organization. If the default grouping doesn’t suit your needs, use custom fingerprints or manual merging to refine it.
15.3 Notes 
Notes in Telebugs allow team members to annotate error reports with additional context, explanations, or updates, fostering collaboration and helping track the resolution process. Notes are visible to all project members and appear in a chronological feed within the error group’s details. This section covers how to create, view, and manage notes, including attachments for richer documentation.
15.3.1 Viewing notes 
Access notes by navigating to an error group’s page and selecting the Notes tab or section. The feed displays each note with:
- User information: The author’s profile picture (or a default avatar), name (linked to their profile if active), and a timestamp (e.g., "5 minutes ago" with a tooltip for the exact UTC time).
- Content: The note’s text, rendered in a monospace font for code snippets or logs, with automatic linkification for URLs.
- Attachments: If included, a grid of thumbnails for images or icons for other files (e.g., videos, documents), with links to download or view. File names and sizes are shown below each item.
- Delete option: Authors can delete their own notes via a trash icon, with a confirmation prompt.
Notes from inactive users are still visible but without profile links. The feed is sorted oldest to newest, making it easy to follow discussions over time.
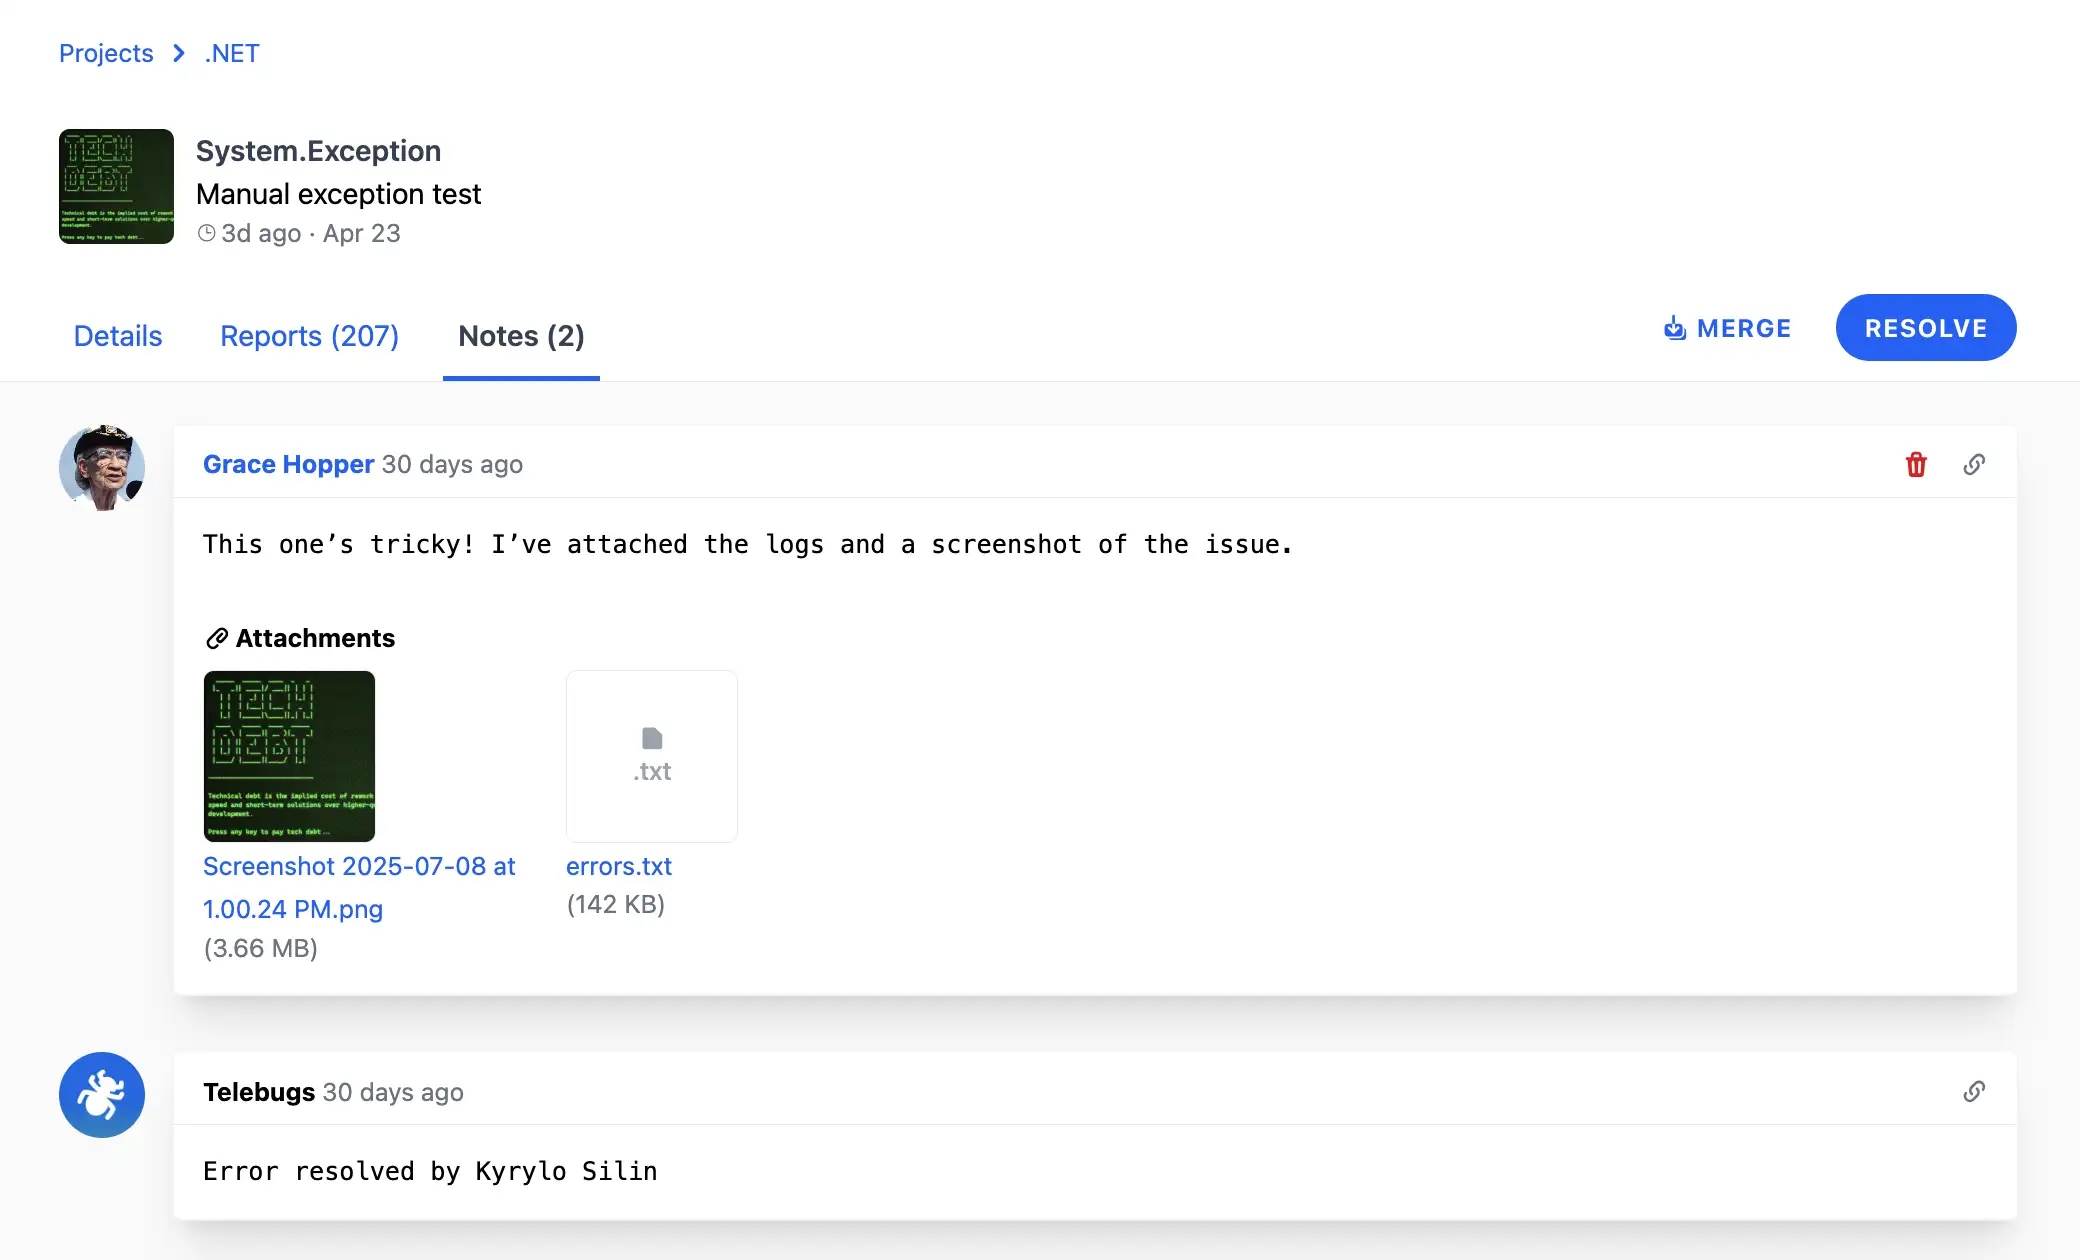
For example, a note might include a screenshot of the error in production, a code diff for a potential fix, or a link to a related ticket in your issue tracker.
Fun fact: The first attachment of an error is used as the error’s main image in the dashboard, providing a quick visual reference.
15.3.2 Adding notes 
To add a note:
- In the error group’s page, scroll to the Add a new note section at the bottom of the notes feed.
- Enter your content in the text area (plain text, supports code blocks or lists via formatting).
- Optionally attach files:
- Click Attach files to open a file picker (supports multiple files).
- Or drag-and-drop files onto the page — an overlay appears prompting to Drop any file here to add it to your note.
- Supported file types include images (displayed as previews), videos, documents, etc. A list of attached files with names and sizes appears below the text area.
- Remove attachments before submitting if needed.
- Click Add note to submit.
Attachments are uploaded directly (with progress indicators if large) and can be up to reasonable sizes; however, for storage management, project admins can purge all note attachments via the project’s danger zone settings, triggering a background job.
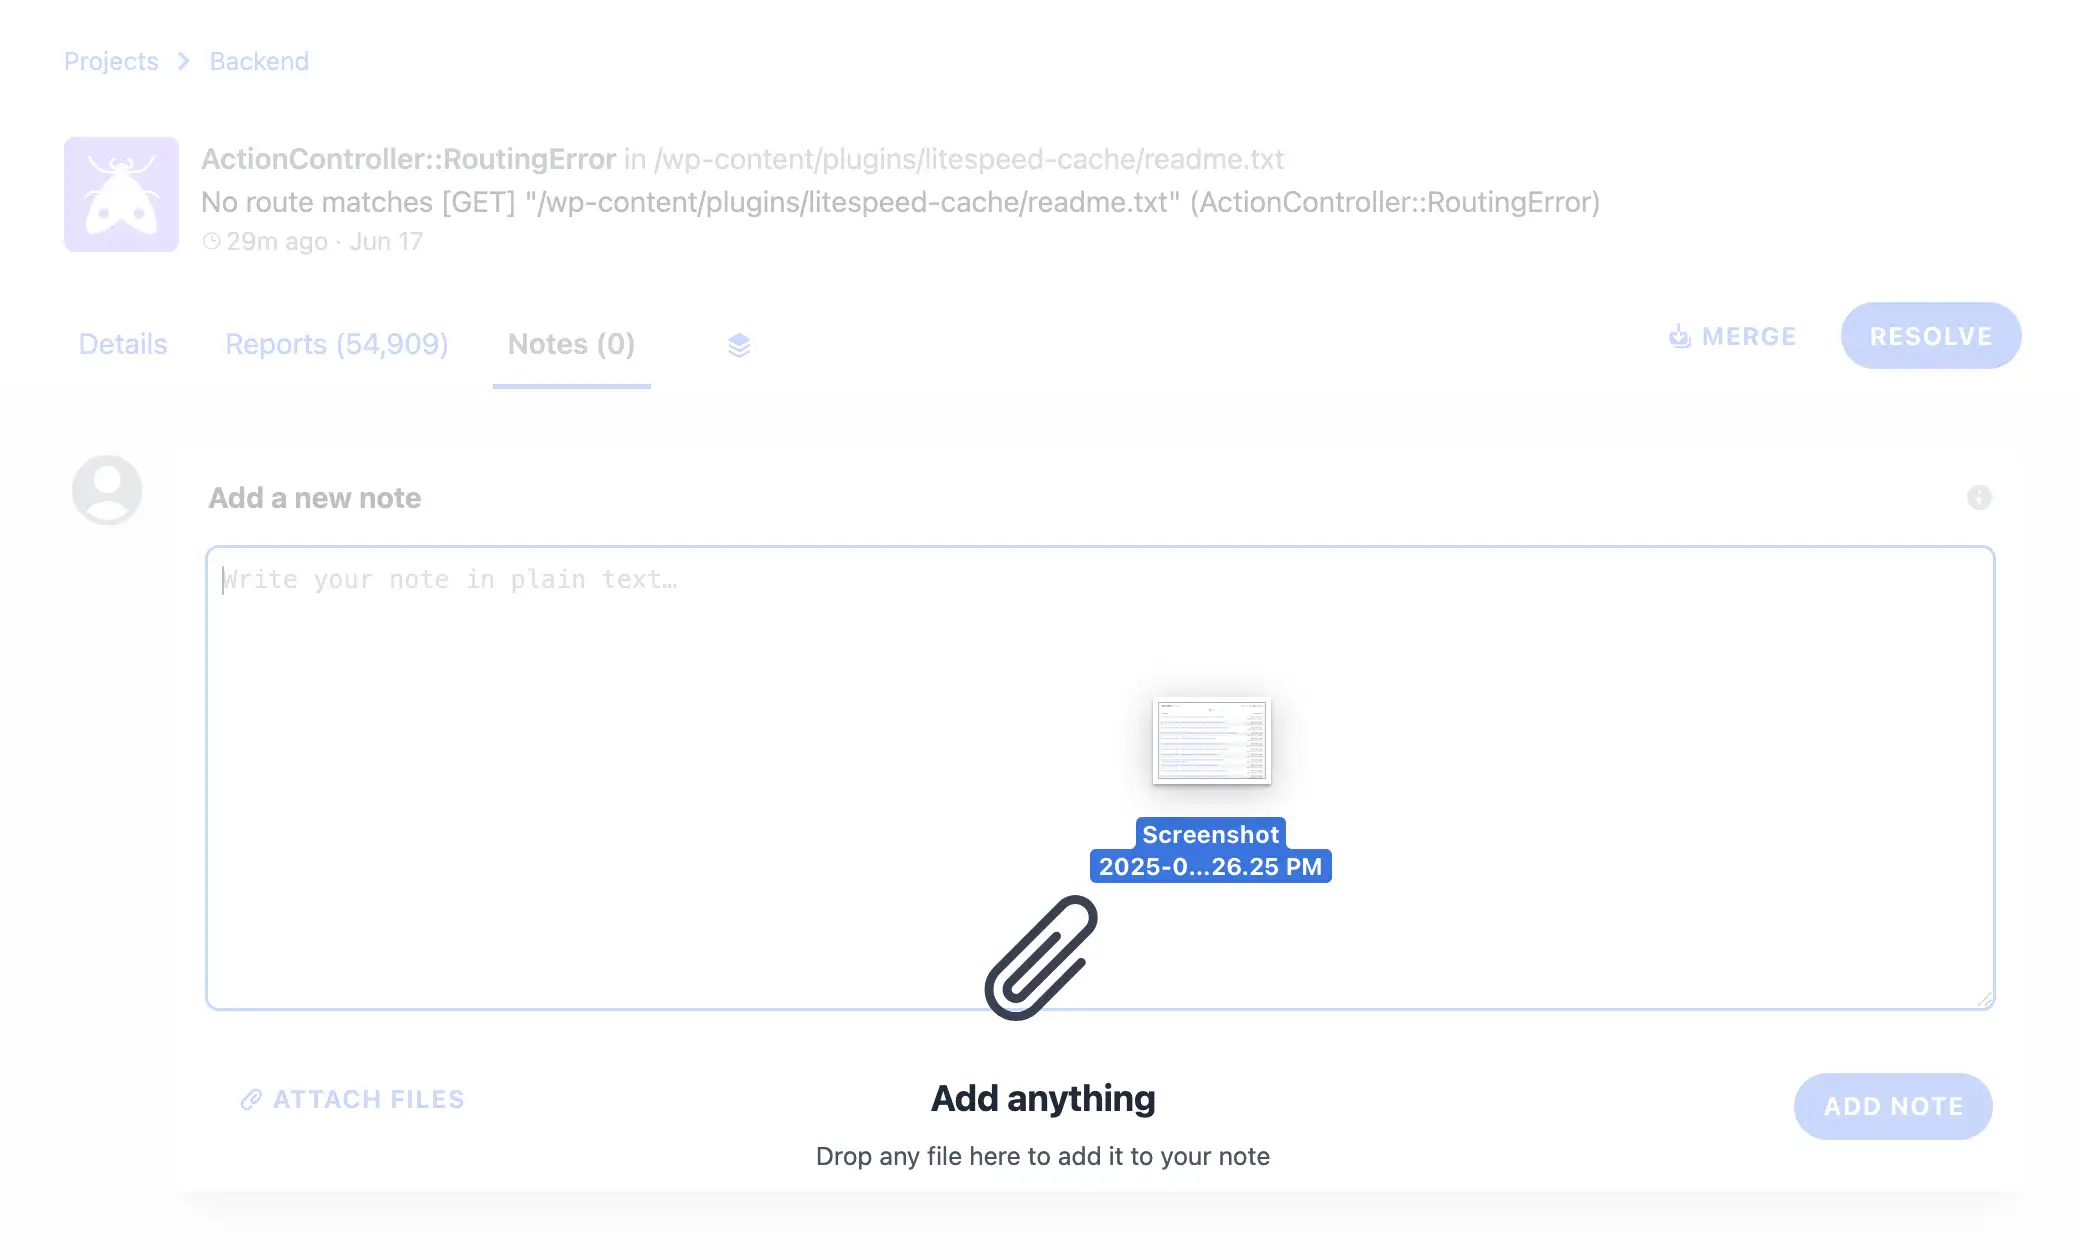
This feature is ideal for collaborative debugging — e.g., one developer adds a reproduction step, another attaches a log file, and a third notes the fix deployment.
15.3.3 Managing notes 
- Editing: Notes cannot be edited after posting; delete and recreate if needed.
- Deletion: Only the author can delete a note, preventing accidental removals.
- Purging attachments: Admins can purge all attachments across a project, useful for data cleanup or compliance. This action is irreversible and runs asynchronously.
- Collaboration tips: Use notes share insights, or log resolutions. Integrate with your workflow by linking to external tools.
Notes enhance team communication, turning error reports into dynamic discussion threads for faster issue resolution.
16 Data retention 
Data retention in Telebugs allows you to manage how long error reports, release artifacts, and related data are stored, balancing storage needs with historical analysis. Policies can be set for automatic cleanup based on time or disk usage, ensuring compliance, cost control, and performance. Telebugs supports full or partial purges for errors and targeted deletions for artifacts. Cleanup jobs run nightly at 2 AM server time, with options for immediate manual actions in project settings.
This chapter covers configuring retention policies for errors and artifacts, understanding purge types, and monitoring disk usage.
16.1 Error retention policy 
The error retention policy controls the lifecycle of error reports and associated data (e.g., backtraces, breadcrumbs, tags). Enable it to automatically remove old or excess data, preventing database bloat. Policies include time-based (deleting reports older than a set period) and disk-based (purging when usage exceeds limits) options.
16.1.1 Enabling error retention 
Access the policy via the "Data Retention" section in settings. Toggle "Enable automatic error cleanup" to activate. Once enabled, configure sub-options for time- or disk-based rules. The UI shows the next cleanup time (e.g., "in 12 hours") and requires saving changes to apply.
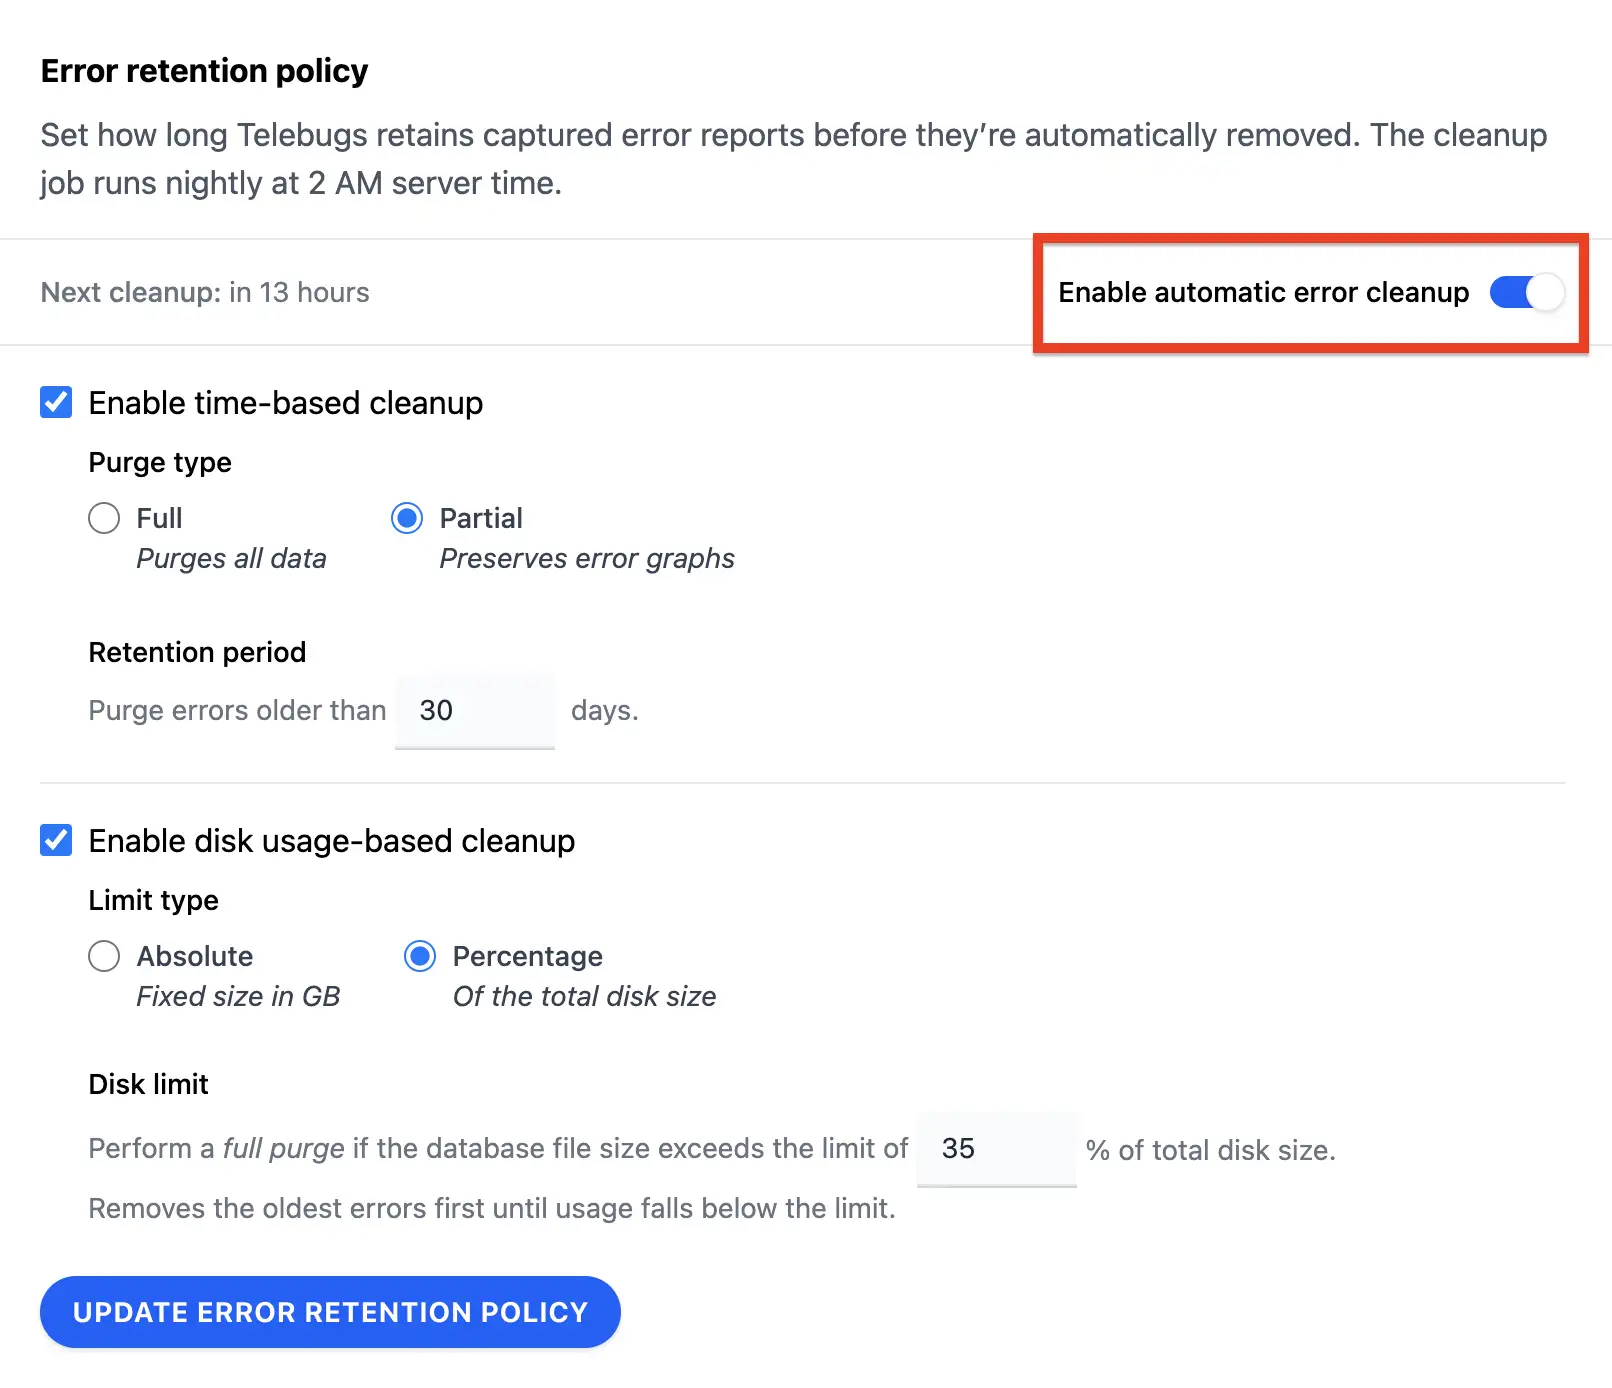
16.1.2 Time-based cleanup 
Time-based cleanup removes reports created before a specified cutoff date (e.g., older than 365 days). Choose between:
- Full purge: Deletes all report data, including related records like notes, logs, and attachments. Ideal for complete cleanup but loses all historical details.
- Partial purge: Preserves core report metadata (e.g., for graphs and counts) while deleting detailed data like backtraces, contexts, and breadcrumbs. Useful for maintaining overviews without full storage.
Set the retention period in days; the job identifies eligible reports and processes them in batches to avoid locking issues.
For example, with a 90-day partial purge, reports from 91+ days ago keep basic stats but lose stack traces.
16.1.3 Disk-based cleanup 
Disk-based cleanup activates when the database file exceeds a limit, purging oldest reports first (full purge only). Limits can be:
- Absolute: Fixed size in GB (e.g., 10 GB).
- Percentage: Of total disk size (e.g., 35%).
The system estimates excess by average report size, then deletes until under the limit. This runs alongside time-based if both enabled.
Monitor via disk stats: total size, free space, database usage (size and percentage), and report count.
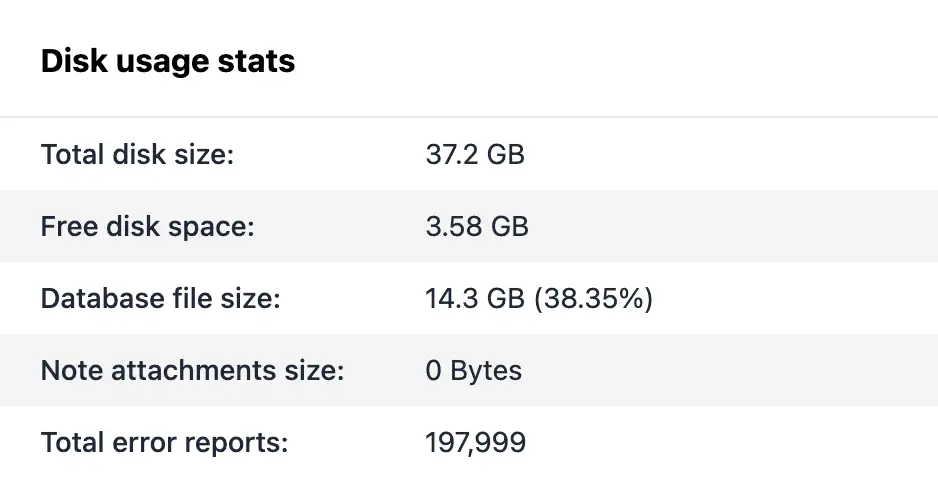
16.2 Artifact retention policy 
Artifacts (e.g., source maps uploaded with releases) have separate retention to manage storage independently. Policies mirror errors but focus on releases without recent reports.
- Enabling artifact retention
- Time-based artifact cleanup
- Disk-based artifact cleanup
- Purge on new release
16.2.1 Enabling artifact retention 
Toggle "Enable automatic artifact cleanup" in settings. Configure time- or disk-based rules, plus an option to purge on new release uploads.
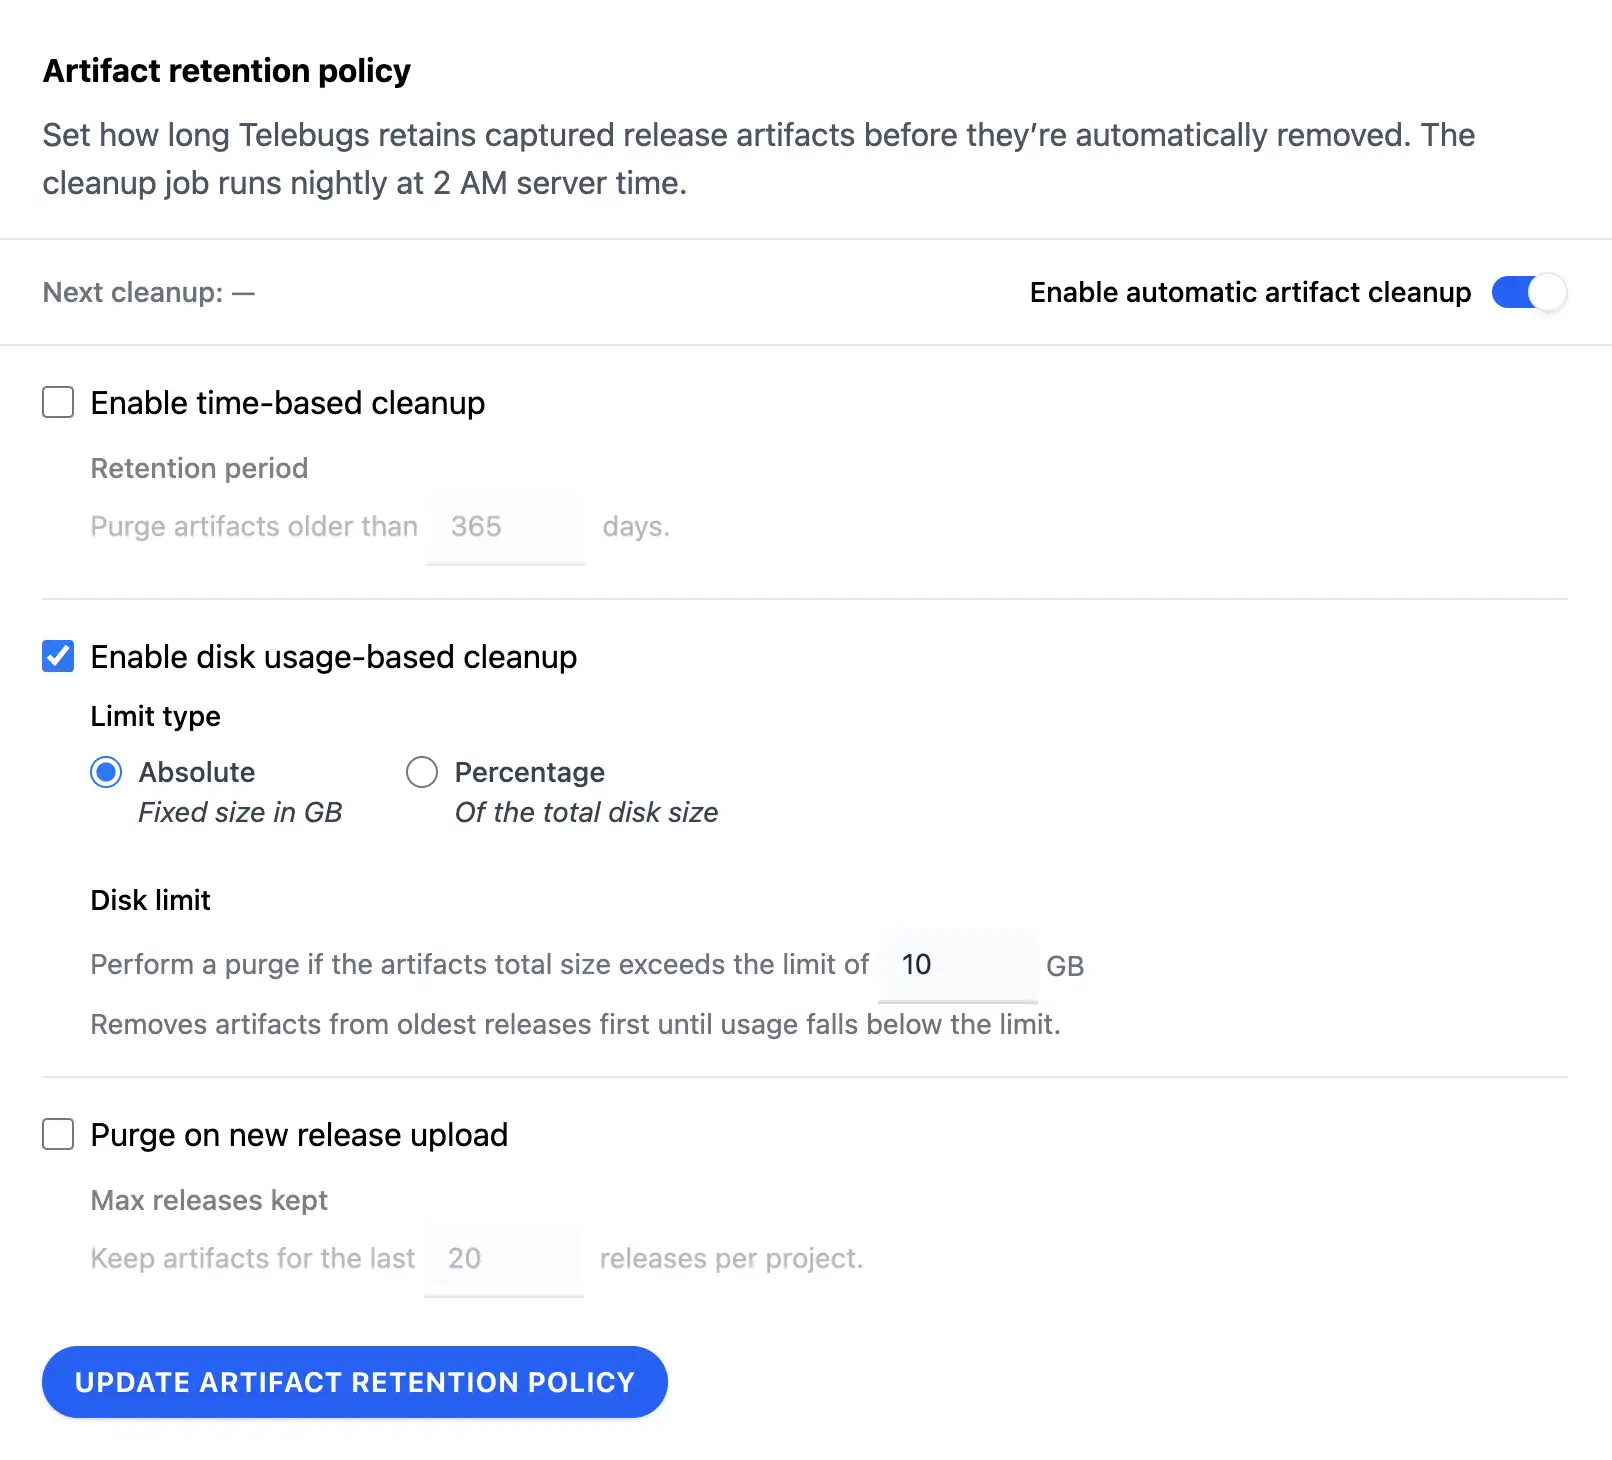
16.2.2 Time-based artifact cleanup 
Deletes artifacts from releases created before the cutoff (e.g., older than 365 days), but only if no recent reports link to them (based on error retention safe cutoff). Purges files and records in batches.
16.2.3 Disk-based artifact cleanup 
Triggers when total artifact size exceeds the limit (absolute GB or percentage). Estimates excess, then deletes from oldest inactive releases (no recent reports) until compliant.
Stats include artifact size and count alongside general disk info.
16.2.4 Purge on new release 
When enabled, uploading a new release triggers cleanup of excess releases beyond a max kept (e.g., 20). Deletes artifacts from oldest inactive releases first, ensuring space for new ones without manual intervention.
16.3 Monitoring and maintenance 
View real-time stats in the Data Retention dashboard: total/free disk, database/artifact sizes, percentages, and counts. Cache refreshes automatically post-cleanup.
For optimization, a VACUUM job reclaims space if sufficient free disk exists (database size + 10% buffer). Run via cron nightly.
Purged data is irreversible; export critical reports beforehand. Use partial purges for errors to retain analytics value. For projects, admins can purge all data or attachments via danger zone, triggering dedicated jobs.
17 Service Messages 
Service Messages in Telebugs provide a simple way to handle essential maintenance tasks for your self-hosted error tracking instance. Tasks like database optimization or data updates are guided directly from the dashboard, with no command-line access needed. This ensures your setup runs efficiently, especially after updates.
Service Messages appear as a red badge on your profile picture in the top-right corner for admins. Once addressed, the badge clears for all admins, supporting team accountability.
Accessing Service Messages 
As an admin, the red badge on your profile picture signals a pending message. Click your profile in the top-right dropdown to see the "Service Messages" item.
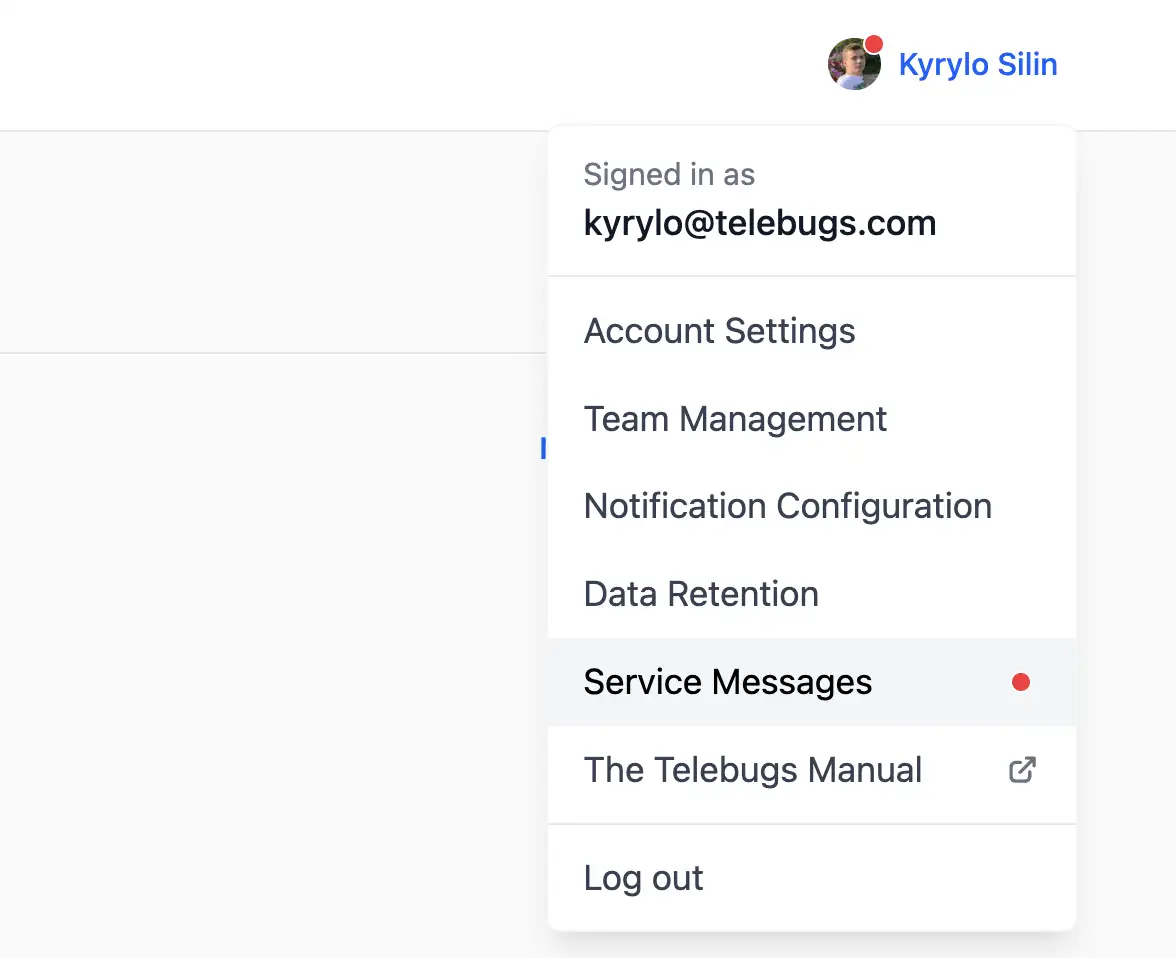
The Service Message index shows a simple table with the list of messages and their statuses. Click a title to view details.
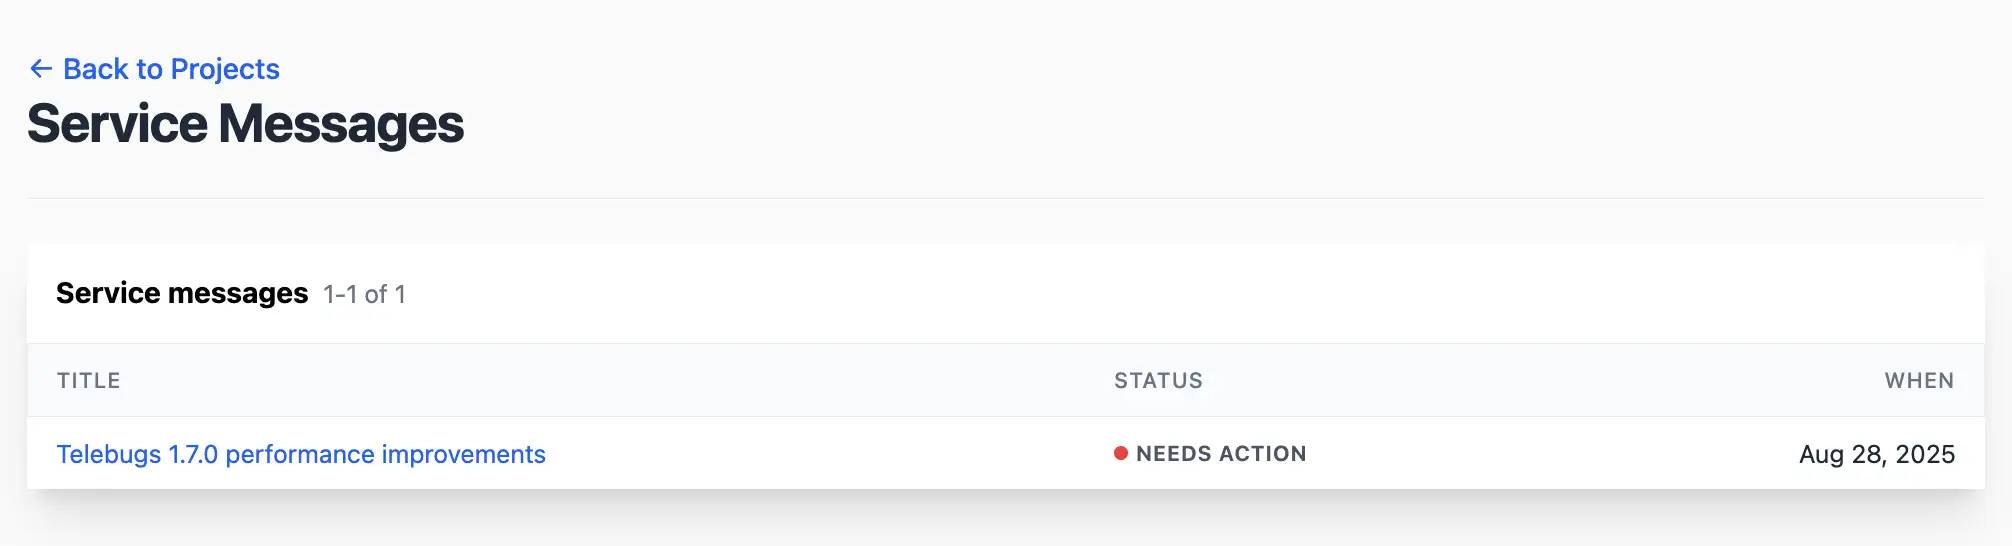
Understanding Service Message statuses 
Each Service Message has a status indicating its progress:
- Needs action: Initial state requiring input, shown in gray.
- In progress: Action started and running in the background, shown in orange.
- Completed: Task finished successfully, shown in green.
- Failed: Issue occurred, shown in red.
Viewing a Service Message 
Click a title to view details, including:
- Title: Task summary.
- Description: Explanation of the action and its benefits.
- Status: Current state with visual tag.
- First read by: Admin who viewed it first, with profile and timestamp (UTC).
- Started by: Admin who triggered it, with start time.
- Started at / Completed at: Action timelines.
- Error message: Failure details, if applicable.
For "Needs action" or "Failed," a "Run Action" button appears at the bottom.
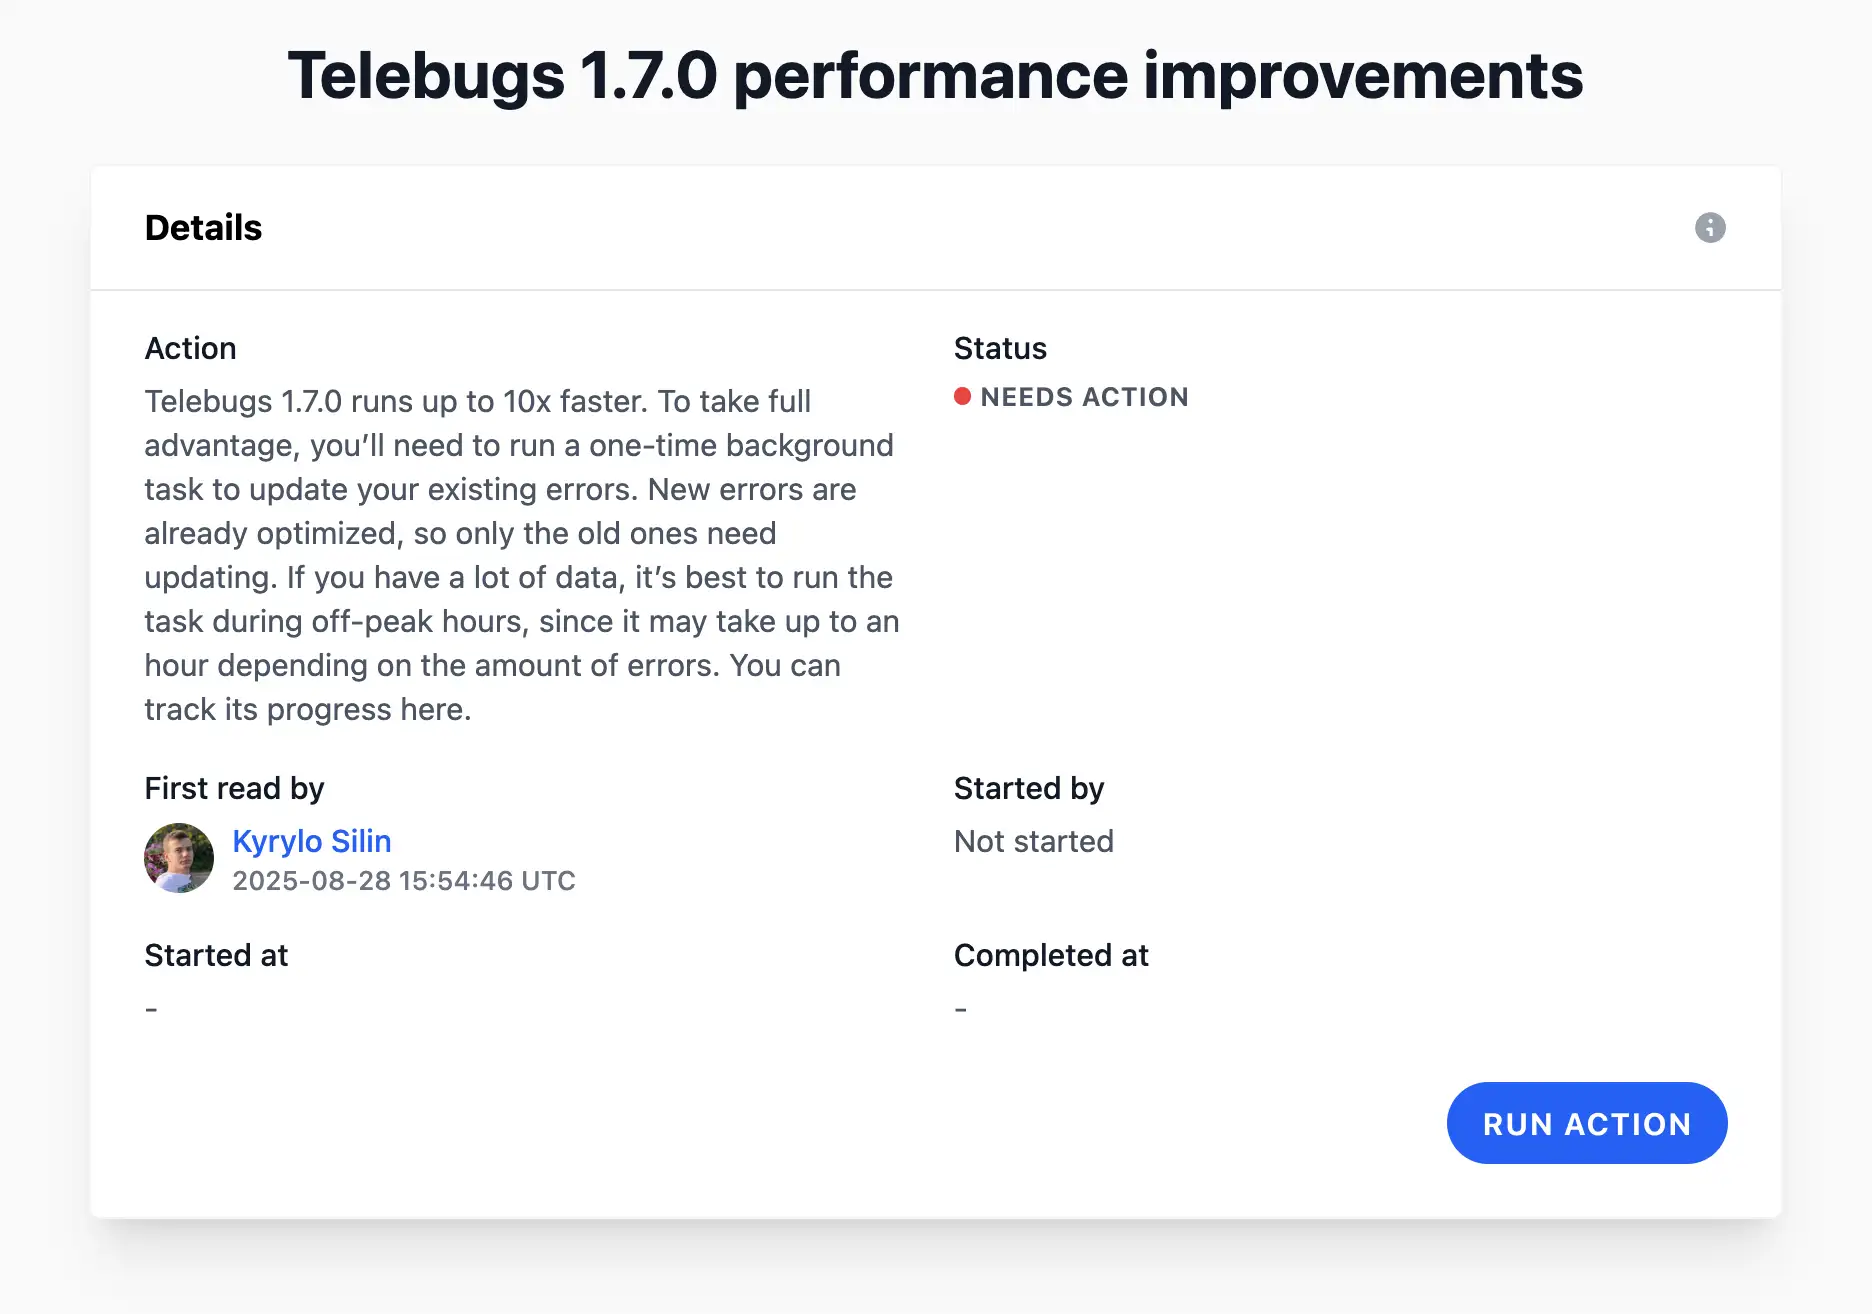
Running action marks it as read automatically, updating the field and clearing your badge. The badge is global for all admins.
Running a Service Message action 
Admins can trigger actions only if the status is "Needs action" or "Failed." The "Run Action" button starts it, updating to "In progress" and logging the user.
Actions run asynchronously in the background. You’ll get a notice like "This may take up to an hour for large datasets." Refresh to check progress.
Once done, the status updates to "Completed" or "Failed," with timestamps and error messages if needed.
Appendix A Software License Agreement 
Copyright © 2025, Kyrylo Silin PE.
Permission is hereby granted to any person purchasing or receiving a copy of Telebugs, its source code and associated documentation files (the “Software”), to install and use a single instance and modify a single version of the Software as provided. This does not include the rights to publish, distribute, sublicense, and/or sell copies of the Software, source code or products derived from it.
THE SOFTWARE IS PROVIDED “AS IS”, WITHOUT WARRANTY OF ANY KIND, EXPRESS OR IMPLIED, INCLUDING BUT NOT LIMITED TO THE WARRANTIES OF MERCHANTABILITY, FITNESS FOR A PARTICULAR PURPOSE AND NON-INFRINGEMENT. IN NO EVENT SHALL THE AUTHORS OR COPYRIGHT HOLDERS BE LIABLE FOR ANY CLAIM, DAMAGES OR OTHER LIABILITY, WHETHER IN AN ACTION OF CONTRACT, TORT OR OTHERWISE, ARISING FROM, OUT OF OR IN CONNECTION WITH THE SOFTWARE OR THE USE OR OTHER DEALINGS IN THE SOFTWARE.
The user of the software represents and warrants that they will at all times comply with applicable law in their download and use of the Software.
Appendix B telebugs command reference 
Install and manage your Telebugs instance.
To run the telebugs command, connect to your server using SSH or your cloud provider’s web-based terminal.
Usage 
telebugs— Displays the main menu with available commands.
Manage passwords 
password— Manage passwords.
Manage automatic updates 
auto-update— Manage automatic updates.
Manage application data 
data— Manage application data.
Additional commands 
help— Displays help information for thetelebugscommand.setup— Runs the initial setup process for Telebugs.start— Start Telebugs.stop— Stop Telebugs.status— Displays the current status of the Telebugs instance.update— Update Telebugs to the latest version.
Flags 
-h,--help— Displays help information for thetelebugscommand.
Use telebugs [command] --help to see detailed help for a specific command.
Appendix C Supported platforms 
Telebugs supports error tracking for a wide range of programming languages, frameworks, and platforms through compatibility with Sentry SDKs. By configuring the appropriate Sentry SDK with your Telebugs DSN, you can send error reports from your application to your Telebugs instance. Below is an exhaustive list of supported platforms, organized by category, with links to setup instructions from Sentry’s official documentation.
Ruby and related frameworks 
- DelayedJob – https://docs.sentry.io/platforms/ruby/guides/delayed_job/
- Rack Middleware – https://docs.sentry.io/platforms/ruby/guides/rack/
- Resque – https://docs.sentry.io/platforms/ruby/guides/resque/
- Ruby – https://docs.sentry.io/platforms/ruby/
- Ruby on Rails – https://docs.sentry.io/platforms/ruby/guides/rails/
- Sidekiq – https://docs.sentry.io/platforms/ruby/guides/sidekiq/
PHP and related frameworks 
- Laravel – https://docs.sentry.io/platforms/php/guides/laravel/
- PHP – https://docs.sentry.io/platforms/php/
- Symfony – https://docs.sentry.io/platforms/php/guides/symfony/
JavaScript and related frameworks 
- Angular – https://docs.sentry.io/platforms/javascript/guides/angular/
- Astro – https://docs.sentry.io/platforms/javascript/guides/astro/
- AWS Lambda (JavaScript) – https://docs.sentry.io/platforms/javascript/guides/aws-lambda/
- Azure Functions (JavaScript) – https://docs.sentry.io/platforms/javascript/guides/azure-functions/
- Bun – https://docs.sentry.io/platforms/javascript/guides/bun/
- Capacitor – https://docs.sentry.io/platforms/javascript/guides/capacitor/
- Cloudflare – https://docs.sentry.io/platforms/javascript/guides/cloudflare/
- Connect – https://docs.sentry.io/platforms/javascript/guides/connect/
- Cordova – https://docs.sentry.io/platforms/javascript/guides/cordova/
- Deno – https://docs.sentry.io/platforms/javascript/guides/deno/
- Electron – https://docs.sentry.io/platforms/javascript/guides/electron/
- Ember – https://docs.sentry.io/platforms/javascript/guides/ember/
- Express – https://docs.sentry.io/platforms/javascript/guides/express/
- Fastify – https://docs.sentry.io/platforms/javascript/guides/fastify/
- Gatsby – https://docs.sentry.io/platforms/javascript/guides/gatsby/
- Google Cloud Functions (JavaScript) – https://docs.sentry.io/platforms/javascript/guides/google-cloud-functions/
- Hapi – https://docs.sentry.io/platforms/javascript/guides/hapi/
- Hono – https://docs.sentry.io/platforms/javascript/guides/hono/
- JavaScript – https://docs.sentry.io/platforms/javascript/
- Koa – https://docs.sentry.io/platforms/javascript/guides/koa/
- Nest.js – https://docs.sentry.io/platforms/javascript/guides/nestjs/
- Next.js – https://docs.sentry.io/platforms/javascript/guides/nextjs/
- Node.js – https://docs.sentry.io/platforms/javascript/guides/node/
- Nuxt – https://docs.sentry.io/platforms/javascript/guides/nuxt/
- React – https://docs.sentry.io/platforms/react/
- React Router Framework – https://docs.sentry.io/platforms/javascript/guides/react-router/
- Remix – https://docs.sentry.io/platforms/javascript/guides/remix/
- Solid – https://docs.sentry.io/platforms/javascript/guides/solid/
- SolidStart – https://docs.sentry.io/platforms/javascript/guides/solidstart/
- Svelte – https://docs.sentry.io/platforms/javascript/guides/svelte/
- SvelteKit – https://docs.sentry.io/platforms/javascript/guides/sveltekit/
- TanStack Start React – https://docs.sentry.io/platforms/javascript/guides/tanstack-react/
- Vue – https://docs.sentry.io/platforms/javascript/guides/vue/
- Wasm – https://docs.sentry.io/platforms/javascript/guides/wasm/
Mobile platforms 
- Android – https://docs.sentry.io/platforms/android/
- Apple – https://docs.sentry.io/platforms/apple/
- Flutter – https://docs.sentry.io/platforms/flutter/
- iOS – https://docs.sentry.io/platforms/apple/guides/ios/integrations/
- macOS – https://docs.sentry.io/platforms/apple/guides/macos/integrations/
- React Native – https://docs.sentry.io/platforms/react-native/
- tvOS – https://docs.sentry.io/platforms/apple/guides/tvos/integrations/
- visionOS – https://docs.sentry.io/platforms/apple/guides/visionos/integrations/
- watchOS – https://docs.sentry.io/platforms/apple/guides/watchos/integrations/
Game engines 
- Godot Engine – https://docs.sentry.io/platforms/godot/
- Nintendo Switch – https://docs.sentry.io/platforms/nintendo-switch/
- Unity – https://docs.sentry.io/platforms/unity/
- Unreal Engine – https://docs.sentry.io/platforms/unreal/
Other languages and frameworks 
- .NET – https://docs.sentry.io/platforms/dotnet/
- AIOHTTP – https://docs.sentry.io/platforms/python/guides/aiohttp/
- Anthropic – https://docs.sentry.io/platforms/python/guides/anthropic/
- Apache Airflow – https://docs.sentry.io/platforms/python/guides/airflow/
- Apache Beam – https://docs.sentry.io/platforms/python/guides/beam/
- Apache Spark – https://docs.sentry.io/platforms/python/guides/spark/
- Ariadne – https://docs.sentry.io/platforms/python/guides/ariadne/
- arq – https://docs.sentry.io/platforms/python/guides/arq/
- ASGI – https://docs.sentry.io/platforms/python/guides/asgi/
- asyncio – https://docs.sentry.io/platforms/python/guides/asyncio/
- asyncpg – https://docs.sentry.io/platforms/python/guides/asyncpg/
- ASP.NET – https://docs.sentry.io/platforms/dotnet/guides/aspnet/
- ASP.NET Core – https://docs.sentry.io/platforms/dotnet/guides/aspnetcore/
- AWS Lambda (.NET) – https://docs.sentry.io/platforms/dotnet/guides/aws-lambda/
- AWS Lambda (Python) – https://docs.sentry.io/platforms/python/guides/aws-lambda/
- Azure Functions (.NET) – https://docs.sentry.io/platforms/dotnet/guides/azure-functions/
- Blazor WebAssembly – https://docs.sentry.io/platforms/dotnet/guides/blazor-webassembly/
- Boto3 – https://docs.sentry.io/platforms/python/guides/boto3/
- Bottle – https://docs.sentry.io/platforms/python/guides/bottle/
- Celery – https://docs.sentry.io/platforms/python/guides/celery/
- Chalice – https://docs.sentry.io/platforms/python/guides/chalice/
- clickhouse-driver – https://docs.sentry.io/platforms/python/guides/clickhouse-driver/
- Cloud Resource Context – https://docs.sentry.io/platforms/python/guides/cloudresourcecontext/
- Cohere – https://docs.sentry.io/platforms/python/guides/cohere/
- Dart – https://docs.sentry.io/platforms/dart/
- Default Integrations – https://docs.sentry.io/platforms/python/guides/default-integrations/
- Django – https://docs.sentry.io/platforms/python/guides/django/
- Dramatiq – https://docs.sentry.io/platforms/python/guides/dramatiq/
- Echo – https://docs.sentry.io/platforms/go/guides/echo/
- Elixir – https://docs.sentry.io/platforms/elixir/
- Entity Framework – https://docs.sentry.io/platforms/dotnet/guides/entityframework/
- Falcon – https://docs.sentry.io/platforms/python/guides/falcon/
- FastAPI – https://docs.sentry.io/platforms/python/guides/fastapi/
- FastHTTP – https://docs.sentry.io/platforms/go/guides/fasthttp/
- Fiber – https://docs.sentry.io/platforms/go/guides/fiber/
- Flask – https://docs.sentry.io/platforms/python/guides/flask/
- Gin – https://docs.sentry.io/platforms/go/guides/gin/
- GNU Backtrace – https://docs.sentry.io/platforms/python/guides/gnu_backtrace/
- Go – https://docs.sentry.io/platforms/go/
- Google Breakpad – https://docs.sentry.io/platforms/native/guides/breakpad/
- Google Cloud Functions (.NET) – https://docs.sentry.io/platforms/dotnet/guides/google-cloud-functions/
- Google Cloud Functions (Python) – https://docs.sentry.io/platforms/python/integrations/gcp-functions/
- Google Crashpad – https://docs.sentry.io/platforms/native/guides/crashpad/
- GQL – https://docs.sentry.io/platforms/python/guides/gql/
- Graphene – https://docs.sentry.io/platforms/python/guides/graphene/
- gRPC – https://docs.sentry.io/platforms/python/guides/grpc/
- HTTPX – https://docs.sentry.io/platforms/python/guides/httpx/
- huey – https://docs.sentry.io/platforms/python/guides/huey/
- Huggingface Hub – https://docs.sentry.io/platforms/python/guides/huggingface_hub/
- Iris – https://docs.sentry.io/platforms/go/guides/iris/
- Java – https://docs.sentry.io/platforms/java/
- java.util.logging – https://docs.sentry.io/platforms/java/guides/jul/
- Kotlin – https://docs.sentry.io/platforms/kotlin/
- Kotlin Multiplatform – https://docs.sentry.io/platforms/kotlin/guides/multiplatform/
- Langchain – https://docs.sentry.io/platforms/python/guides/langchain/
- LaunchDarkly – https://docs.sentry.io/platforms/python/guides/launchdarkly/
- Litestar – https://docs.sentry.io/platforms/python/guides/litestar/
- Log4j 2.x – https://docs.sentry.io/platforms/java/guides/log4j2/
- Logback – https://docs.sentry.io/platforms/java/guides/logback/
- Logging – https://docs.sentry.io/platforms/python/guides/logging/
- log4net – https://docs.sentry.io/platforms/dotnet/guides/log4net/
- Logrus – https://docs.sentry.io/platforms/go/guides/logrus/
- Loguru – https://docs.sentry.io/platforms/python/guides/loguru/
- MAUI – https://docs.sentry.io/platforms/dotnet/guides/maui/
- Microsoft.Extensions.Logging – https://docs.sentry.io/platforms/dotnet/guides/extensions-logging/
- Minidumps – https://docs.sentry.io/platforms/native/guides/minidumps/
- Native – https://docs.sentry.io/platforms/native/
- Negroni – https://docs.sentry.io/platforms/go/guides/negroni/
- net/http – https://docs.sentry.io/platforms/go/guides/http/
- NLog – https://docs.sentry.io/platforms/dotnet/guides/nlog/
- Oban – https://docs.sentry.io/platforms/elixir/integrations/oban/
- OpenAI – https://docs.sentry.io/platforms/python/guides/openai/
- OpenFeature – https://docs.sentry.io/platforms/python/guides/openfeature/
- Phoenix – https://docs.sentry.io/platforms/elixir/integrations/plug_and_phoenix/
- PowerShell – https://docs.sentry.io/platforms/powershell/
- pure_eval – https://docs.sentry.io/platforms/python/guides/pure_eval/
- PyMongo – https://docs.sentry.io/platforms/python/guides/pymongo/
- Pyramid – https://docs.sentry.io/platforms/python/guides/pyramid/
- Qt – https://docs.sentry.io/platforms/native/guides/qt/
- Quantum – https://docs.sentry.io/platforms/elixir/integrations/quantum/
- Quart – https://docs.sentry.io/platforms/python/guides/quart/
- Ray – https://docs.sentry.io/platforms/python/guides/ray/
- Redis – https://docs.sentry.io/platforms/python/guides/redis/
- RQ (Redis Queue) – https://docs.sentry.io/platforms/python/guides/rq/
- Rust – https://docs.sentry.io/platforms/rust/
- Rust Tracing – https://docs.sentry.io/platforms/python/guides/rust_tracing/
- Sanic – https://docs.sentry.io/platforms/python/guides/sanic/
- Serverless – https://docs.sentry.io/platforms/python/guides/serverless/
- Serilog – https://docs.sentry.io/platforms/dotnet/guides/serilog/
- Servlet – https://docs.sentry.io/platforms/java/guides/servlet/
- Slog – https://docs.sentry.io/platforms/go/guides/slog/
- Socket – https://docs.sentry.io/platforms/python/guides/socket/
- Spring – https://docs.sentry.io/platforms/java/guides/spring/
- Spring Boot – https://docs.sentry.io/platforms/java/guides/spring-boot/
- SQLAlchemy – https://docs.sentry.io/platforms/python/guides/sqlalchemy/
- Starlette – https://docs.sentry.io/platforms/python/guides/starlette/
- Statsig – https://docs.sentry.io/platforms/python/guides/statsig/
- Strawberry – https://docs.sentry.io/platforms/python/guides/strawberry/
- sys.exit – https://docs.sentry.io/platforms/python/guides/sys_exit/
- Tornado – https://docs.sentry.io/platforms/python/guides/tornado/
- Tryton – https://docs.sentry.io/platforms/python/guides/tryton/
- Typer – https://docs.sentry.io/platforms/python/guides/typer/
- Unleash – https://docs.sentry.io/platforms/python/guides/unleash/
- UWP – https://docs.sentry.io/platforms/dotnet/guides/uwp/
- WebAssembly – https://docs.sentry.io/platforms/native/guides/wasm/
- Windows Forms – https://docs.sentry.io/platforms/dotnet/guides/winforms/
- WPF – https://docs.sentry.io/platforms/dotnet/guides/wpf/
- WSGI – https://docs.sentry.io/platforms/python/guides/wsgi/
- Xamarin – https://docs.sentry.io/platforms/dotnet/guides/xamarin/
- Zerolog – https://docs.sentry.io/platforms/go/guides/zerolog/
This list reflects all platforms we currently support. For the most up-to-date information or additional setup details, refer to https://docs.sentry.io/platforms/.
Appendix D Installing on DigitalOcean 
Using Digital Ocean to host Telebugs is a great choice. It’s affordable and easy to set up.
After signing up for a Digital Ocean account, follow these steps. It should take about 5 minutes.
- In your Digital Ocean account, go to
Create > Dropletsand pick a plan for your server.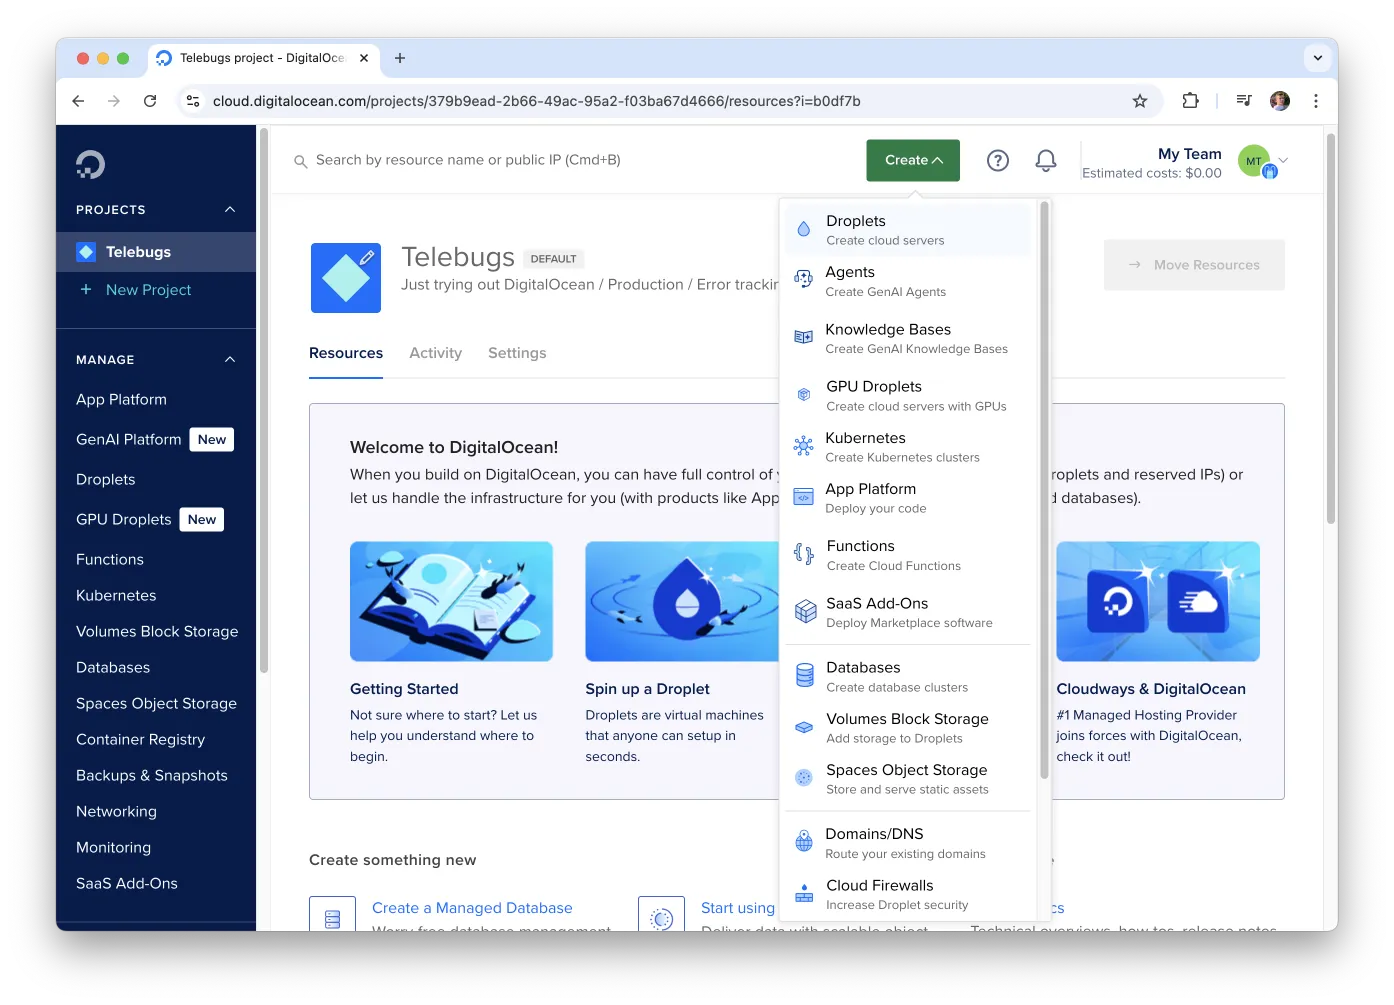 You need at least 2GB RAM and 1 CPU.
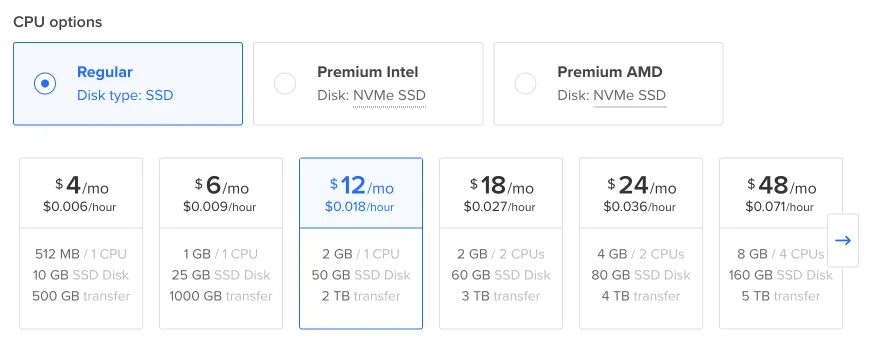
- Set a password to connect to your server.
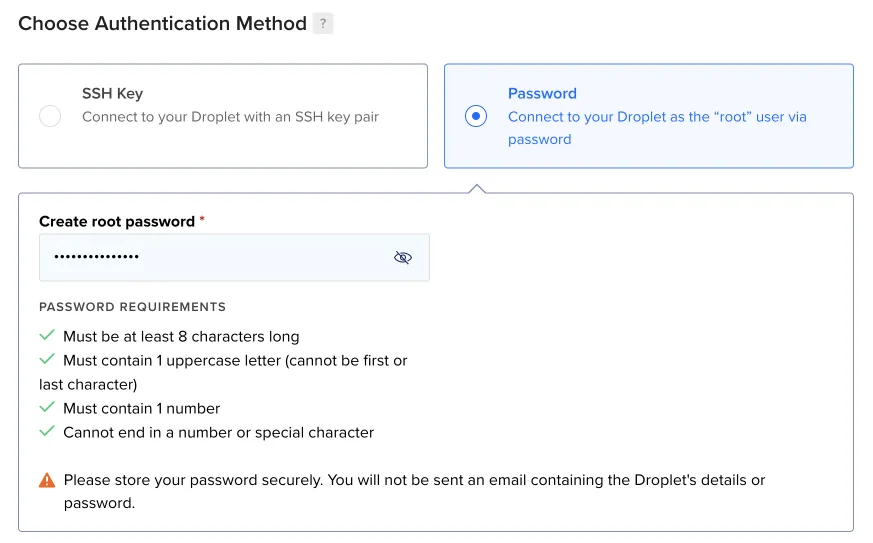
- Leave the other settings as they are and click Create Droplet. Wait a few minutes for it to be ready, then click it.

- Copy the
ipv4address. You’ll use it to link your domain to this server.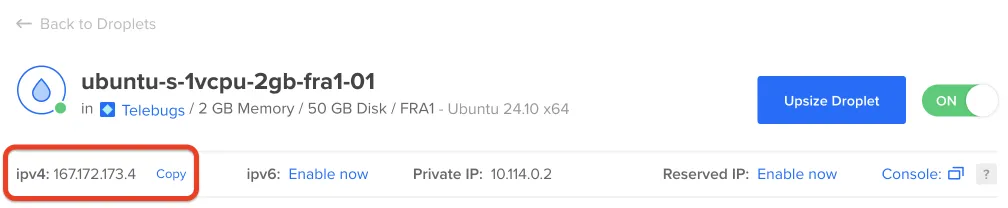 Go to your domain provider’s site (like GoDaddy, namecheap, or Cloudflare). Log in, find the domain management section, and add an
 A recordwith the IP you copied. It should look like this: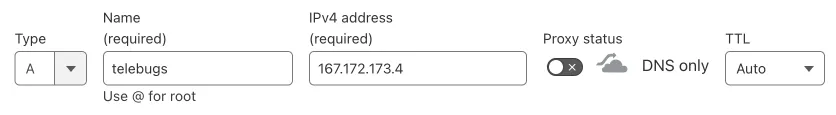 Ensure that proxying is disabled.
- Back in Digital Ocean, find your Droplet and open the Console to access your server.
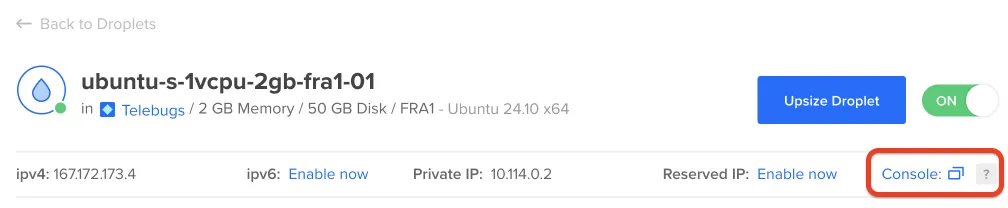
- Check the confirmation email we sent you for the install command. Paste it into the command line.
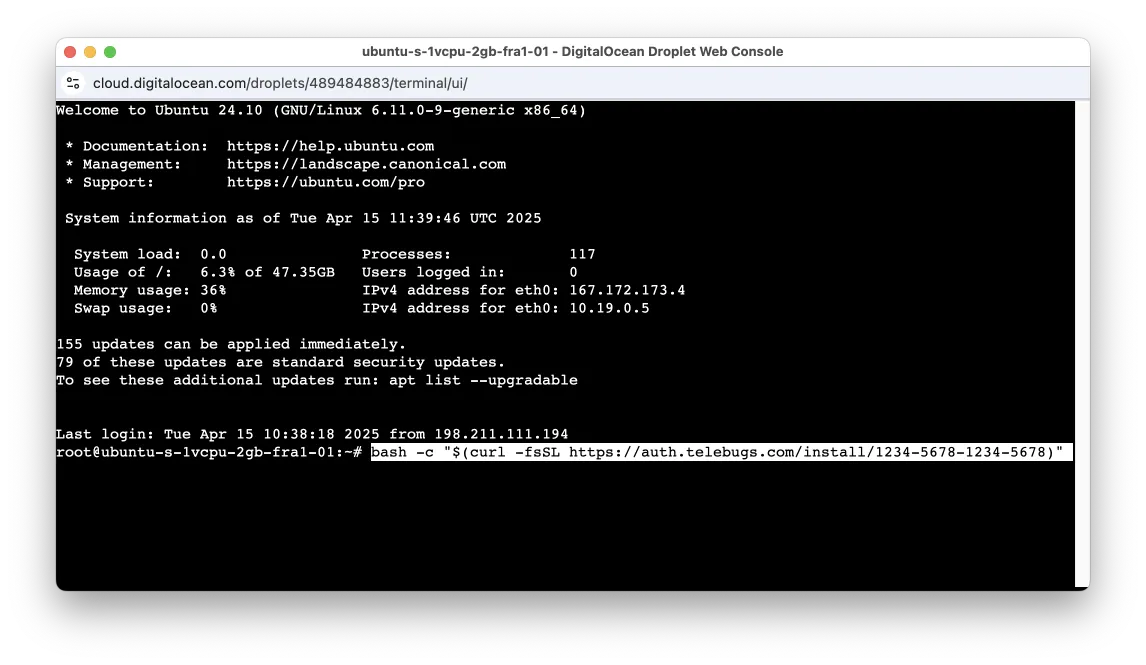
- When prompted, type your domain name (the same one you used for the A record). The system will finish the setup. After a few minutes, you’ll see this:
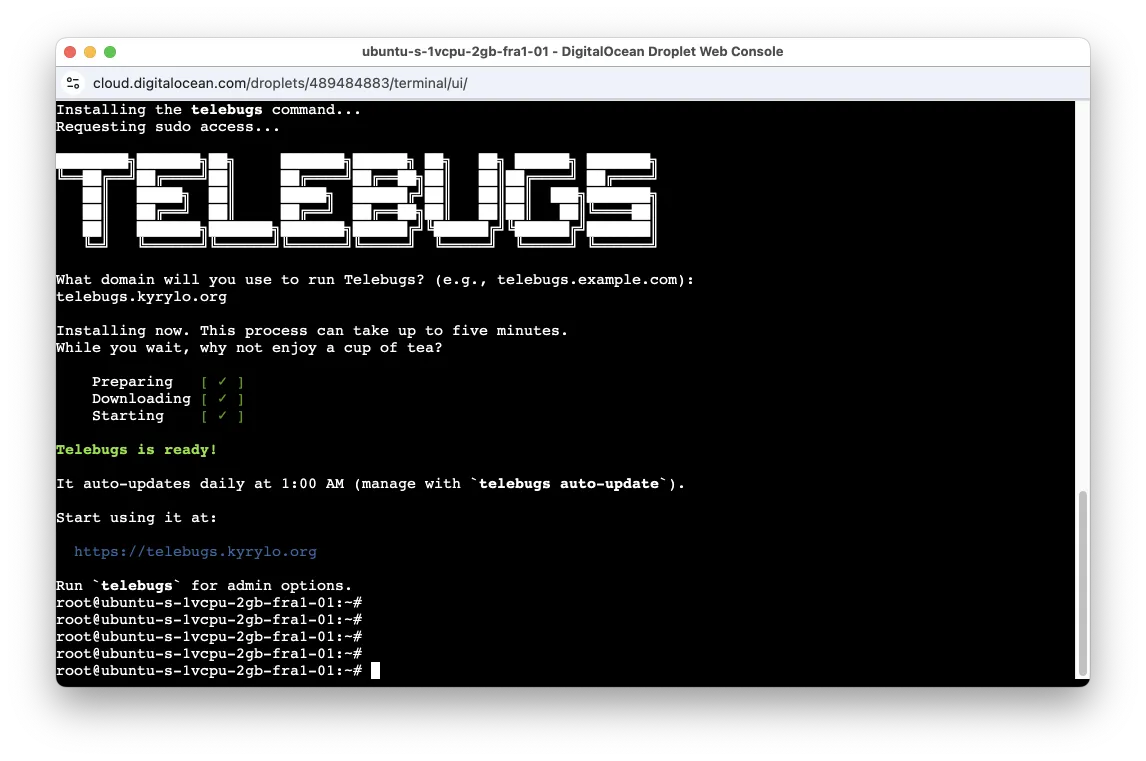
- All set! Open the URL in your browser and create your Telebugs account.
Appendix E Installing on Hetzner 
Hosting Writebook on Hetzner is a smart pick. It’s budget-friendly and simple to set up if you’re comfortable with some basic tech steps.
After signing up for a Hetzner account, follow these steps. It should take about 5 minutes.
- In your Hetzner account, click + Create Server and pick a plan.
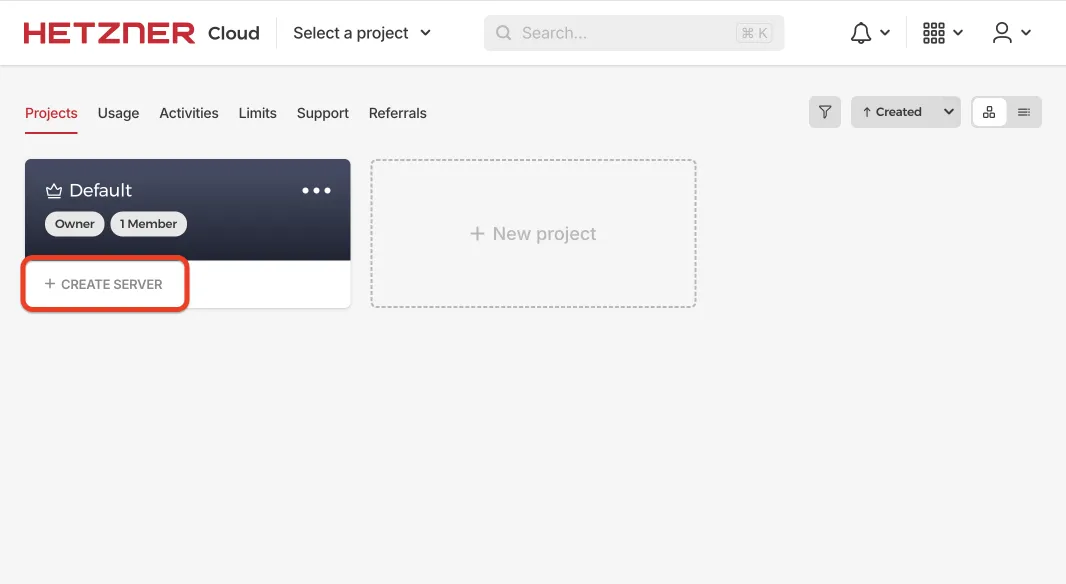
You need at least 2GB RAM and 1 CPU.
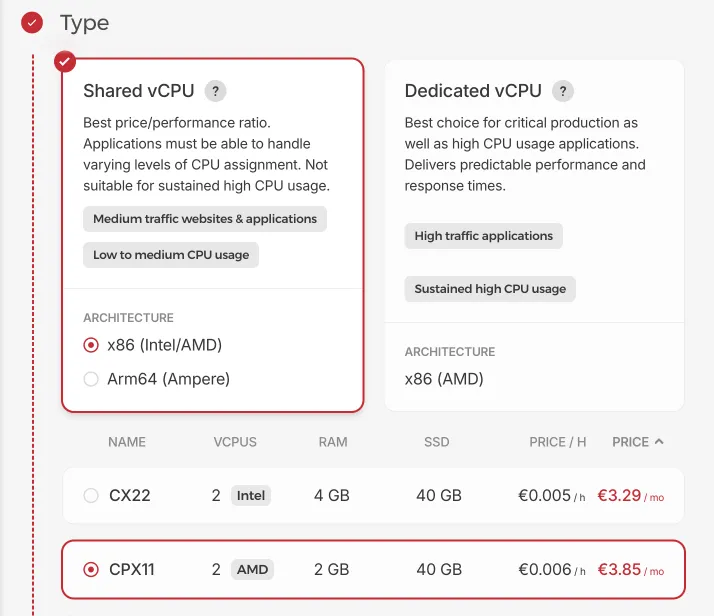
- Keep the default settings and click Create and Buy now. Your server will be ready in a few minutes.
- Once it’s ready, copy the Public IP address. This links your domain to the server.

- Go to your domain provider’s site (like GoDaddy, namecheap, or Cloudflare). Log in, find the domain management section, and add an
A recordwith the IP you copied. It should look like this: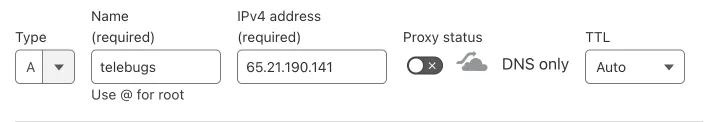 Ensure that proxying is disabled.
- Back in Hetzner, open the Console to connect to your server.
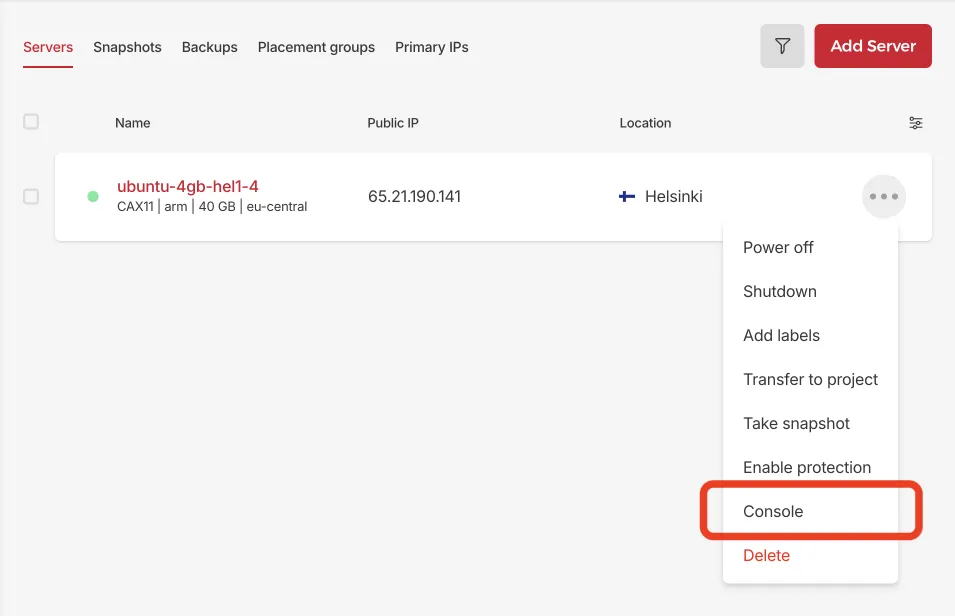
- Check the confirmation email we sent you for the install command. Paste it into the command line.
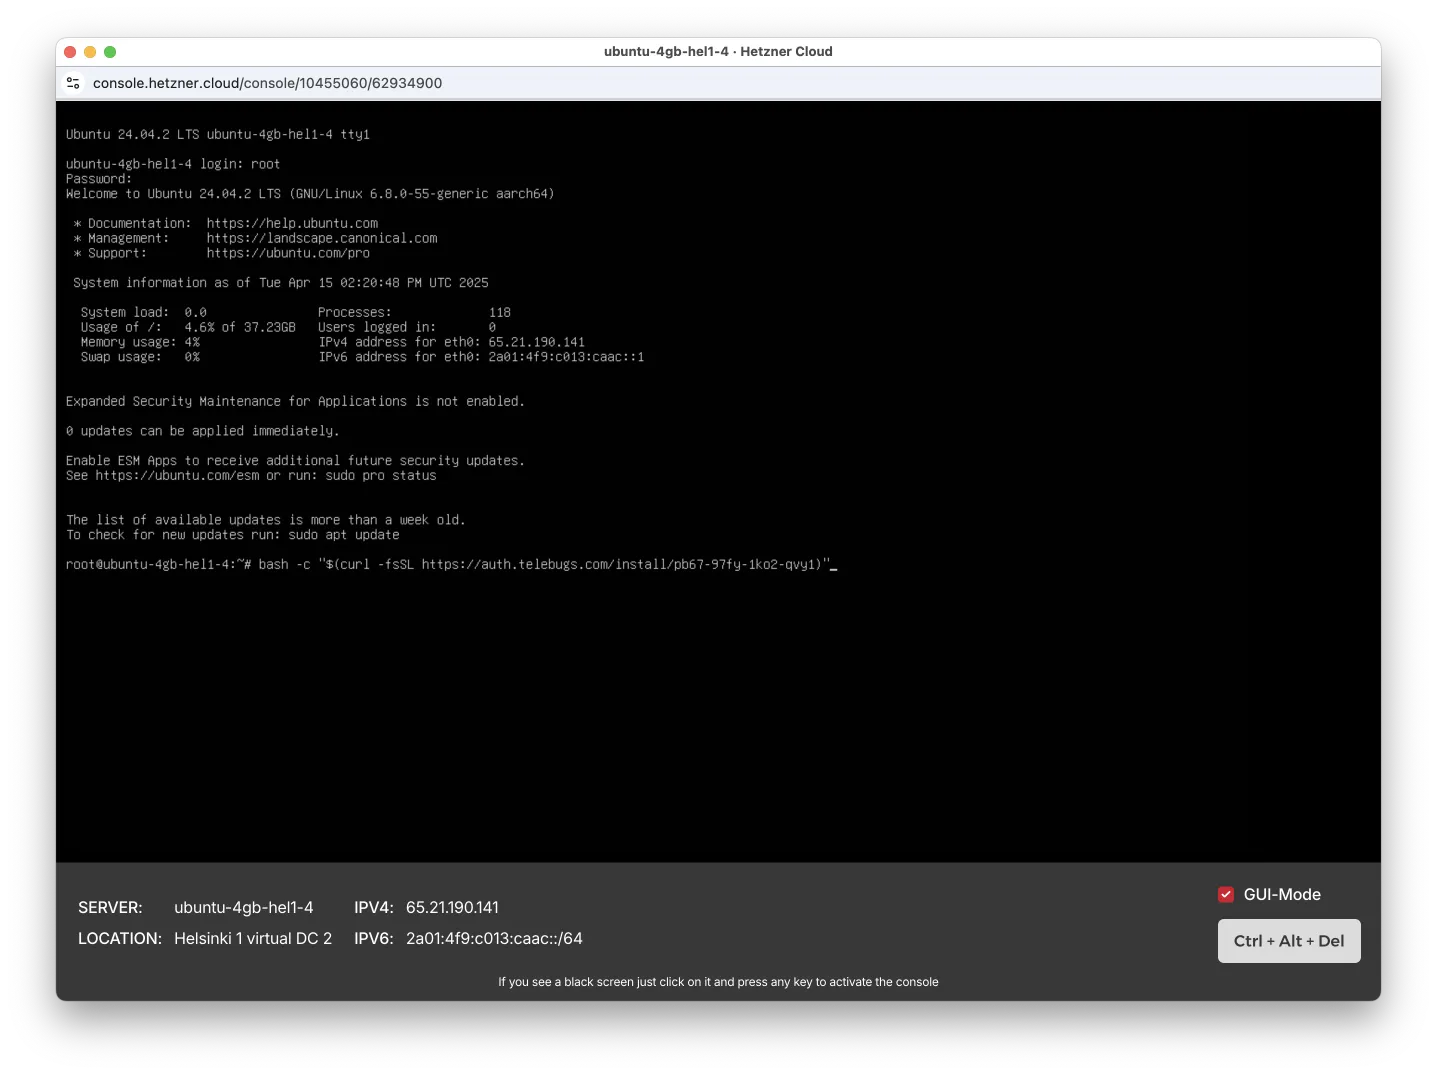
- When prompted, type your domain name (the same one you used for the A record). The system will finish the setup. After a few minutes, you’ll see this:
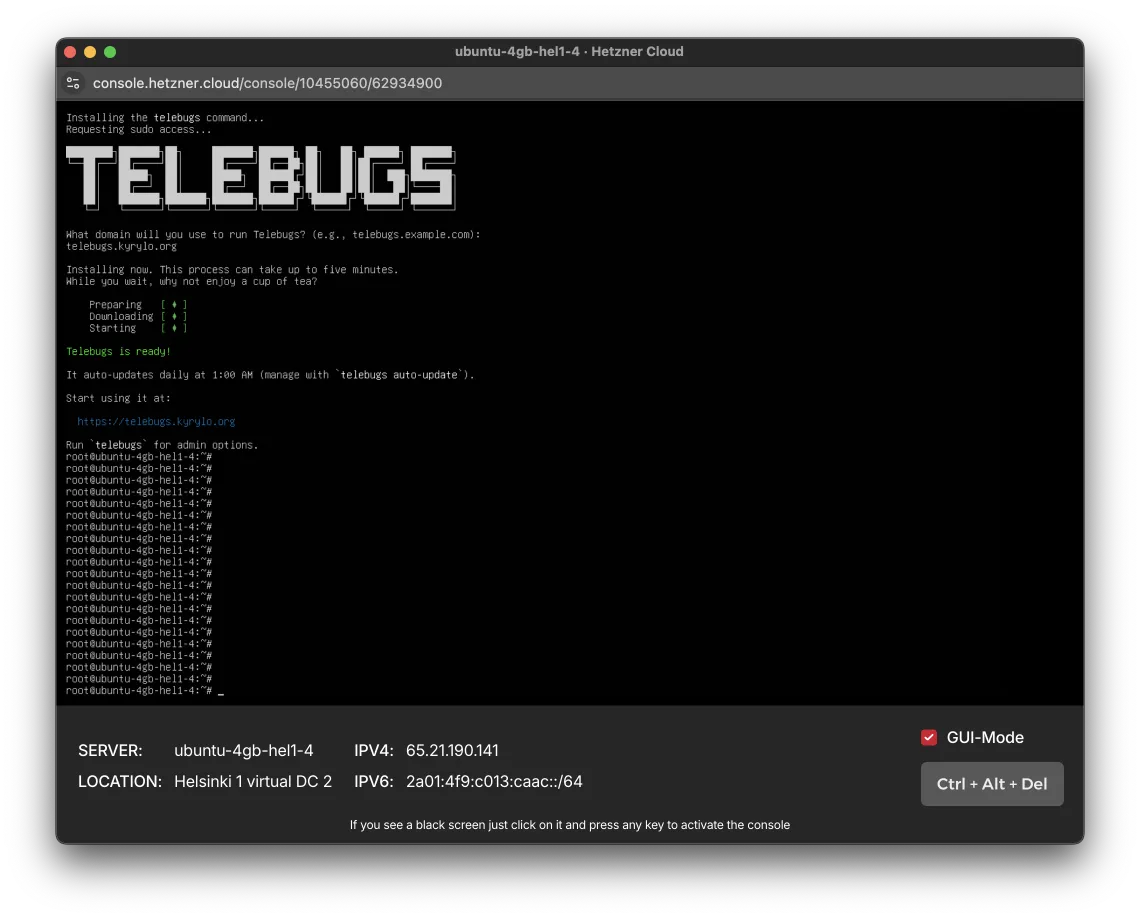
- All set! Open the URL in your browser and create your Telebugs account.