7 Sending your first error report 
You’ve got your project set up — excellent! Now comes the key step: sending that first error report to Telebugs. This connects your app to Telebugs so it can start catching and displaying those pesky bugs automatically. This chapter guides you through integrating a Sentry SDK, troubleshooting common issues, and what to expect next. By the end, you’ll be seeing real error data roll in. Let’s connect your app to Telebugs!
Introduction to error reports 
Error reports are the lifeblood of debugging — they’re like detailed snapshots of what went wrong in your app. You might call them exceptions, crashes, or stack traces, but in Telebugs, we stick with "error reports" because that’s how you’ll interact with them in Telebugs’ clean, intuitive UI. These reports include everything from the error message to the code path that led there, helping you fix issues fast. Think of it as your app’s way of saying, "Hey, something broke — here’s the full story!"
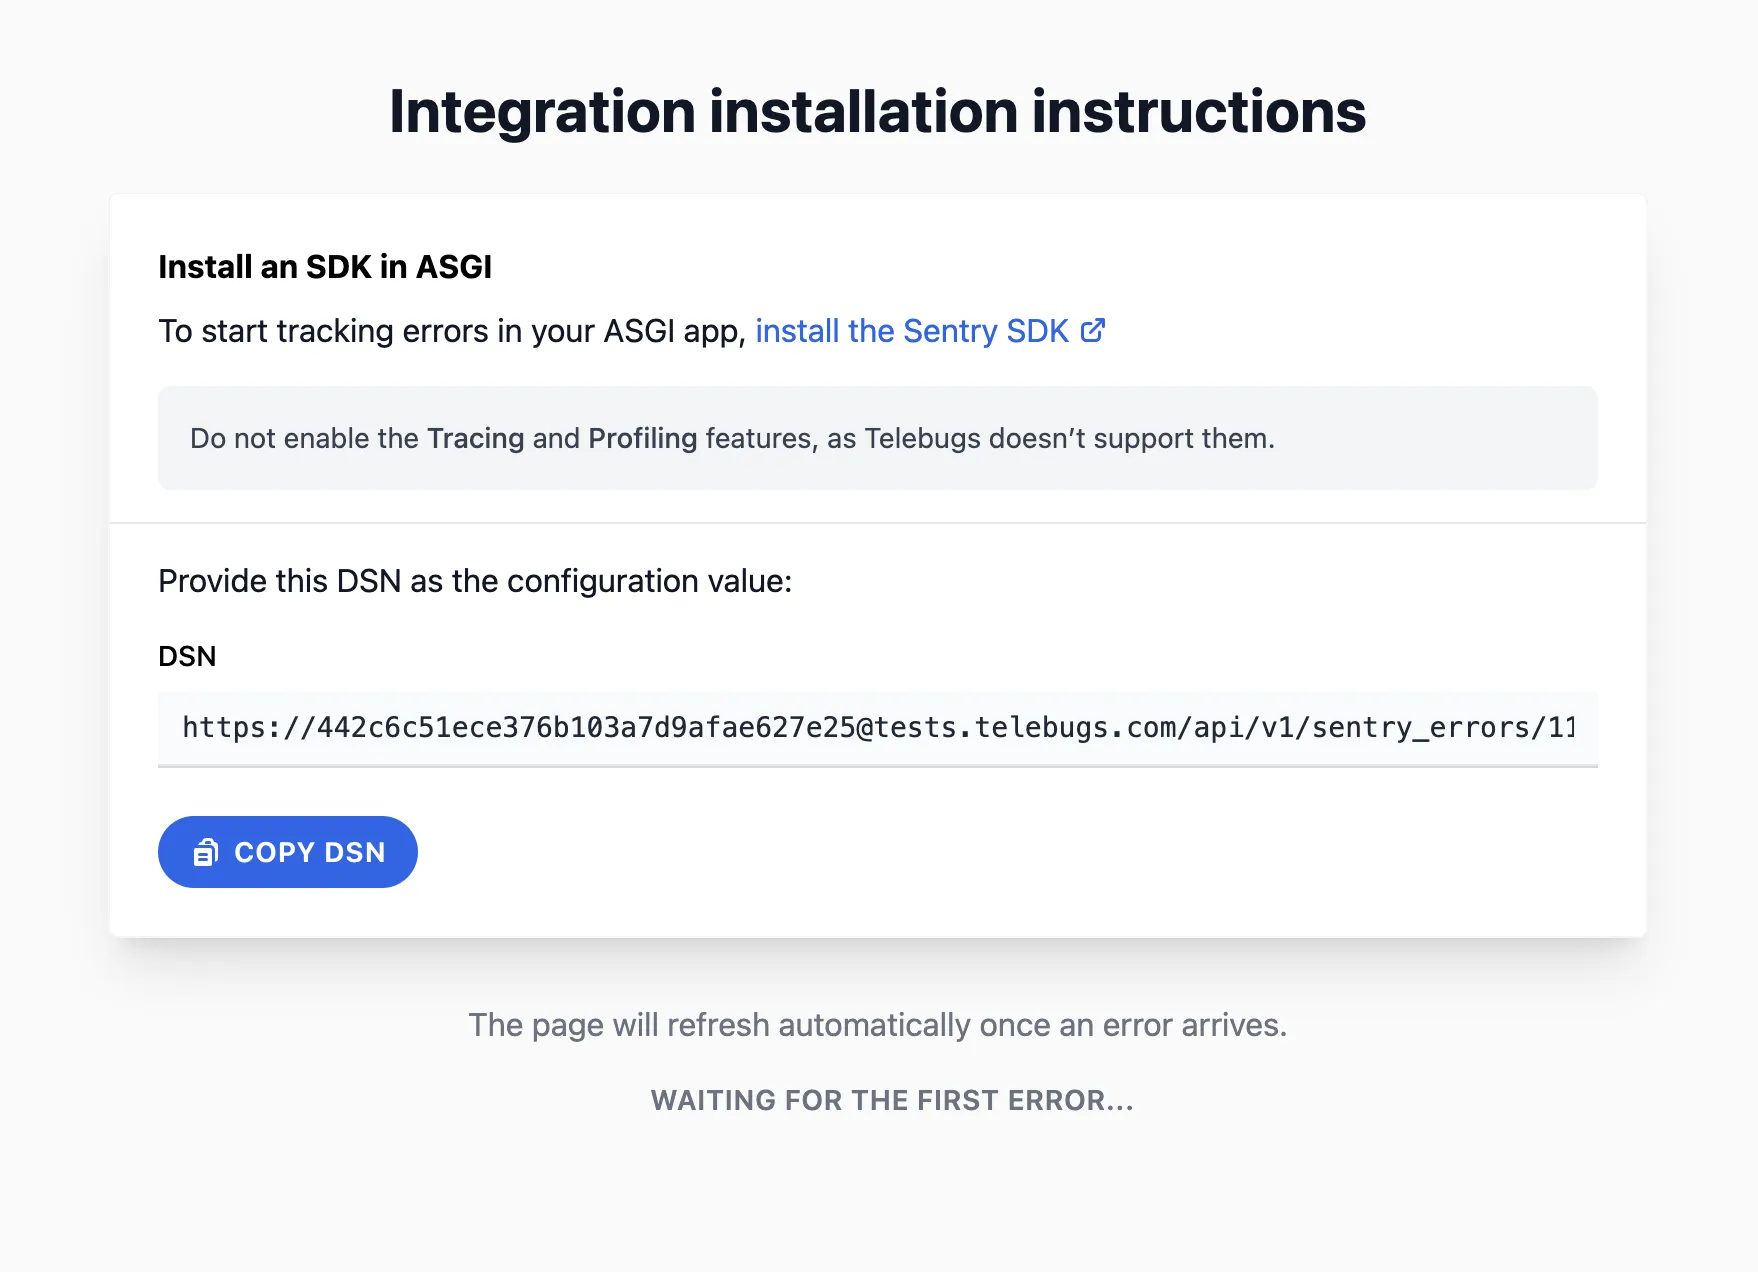
Viewing installation instructions 
If your project is fresh and error-free, Telebugs greets you with tailored SDK setup instructions right on the dashboard. No guesswork needed! These steps link straight to Sentry’s official docs, customized for the platform you picked during project creation. Spot the DSN (Data Source Name) here — it’s your project’s unique address for sending errors.
Installing the Sentry SDK 
Time to get hands-on! Follow Sentry’s platform-specific guide to add the SDK to your app. It’s usually a quick gem install, package add, or script include.
Here’s a snappy example for Ruby on Rails to give you the feel:
- Add the gem to your Gemfile:
# Gemfile
gem "sentry-rails"
- Install it:
$ bundle install
- Initialize in a config file:
# config/initializers/sentry.rb
Sentry.init do |config|
  config.dsn = "https://[email protected]/123"
  config.breadcrumbs_logger = [ :active_support_logger, :http_logger ]
  config.send_default_pii = true  # Optional: Adds user context like IP
end
Restart your server after setup. For other platforms like JavaScript or Python, the process is similar — just swap in the right package and config. If you’re new to Sentry, their docs are gold — follow along closely.
Using your Telebugs DSN 
The DSN is your secret sauce: a URL that routes errors from your app to
Telebugs. Grab it from your project page (it looks like
https://[email protected]/project-id). Paste it exactly into your
SDK init code — no typos! Quick check: Trigger a test error in your app (e.g.,
raise "Test error" in Ruby). If it shows up in Telebugs, you’re golden.
No luck? Verify the DSN and restart.
Feature compatibility notes 
Telebugs focuses on rock-solid error tracking, so stick to core features. Turn
off Tracing, Profiling, Session Replay, or Performance Monitoring in your SDK
config — they won’t work here and might clutter things. But go wild with
breadcrumbs, contexts, and tags — they enrich your reports beautifully! Example
tweak in config: Set config.traces_sample_rate = 0.0 to disable tracing.
Common mistakes and troubleshooting 
Hitting a snag? You’re not alone — here’s how to squash the usual suspects:
- SDK installed, but no reports show: Is your app actually erroring? Force one with a deliberate crash. Also, check if the SDK is initialized early in your app lifecycle.
- "Invalid DSN" woes: Copy-paste the full DSN again — easy to miss a character. Test with a minimal setup if needed.
- Changes not sticking: Always restart your app or server post-config. In containers? Redeploy.
- Firewall or network blocks: Ensure your app can reach Telebugs’ API endpoint.
Still stuck? Double-check Sentry docs for your platform or drop me a line — I’m here to help!
Next steps 
Boom — your first error just landed! Telebugs auto-updates the dashboard, so watch those reports flow in. Now explore:
- Dive into error details: Stack traces, contexts, and more (see Error reports).
- Resolve or assign issues: Keep your backlog tidy.
- Set up notifications: Get alerted in real-time (see Notifications).
- Invite your team: Share the debugging love (see Team management).
Pro tip: Simulate a few errors with different scenarios to see how Telebugs handles them. It’ll build your confidence fast!
Glossary 
Quick reference for the jargon:
- Error report
Your app’s "oops" moment captured: message, stack trace, and context.
- DSN
Data Source Name: The URL directing errors to your Telebugs project.
- SDK
Software Development Kit: The library you add to auto-report errors.
- Breadcrumb
Trail of events before the crash — super helpful for "what happened?"
- Platform
Your app’s tech (e.g., Ruby on Rails) — guides SDK choice and setup.