11.2 Individual project view 
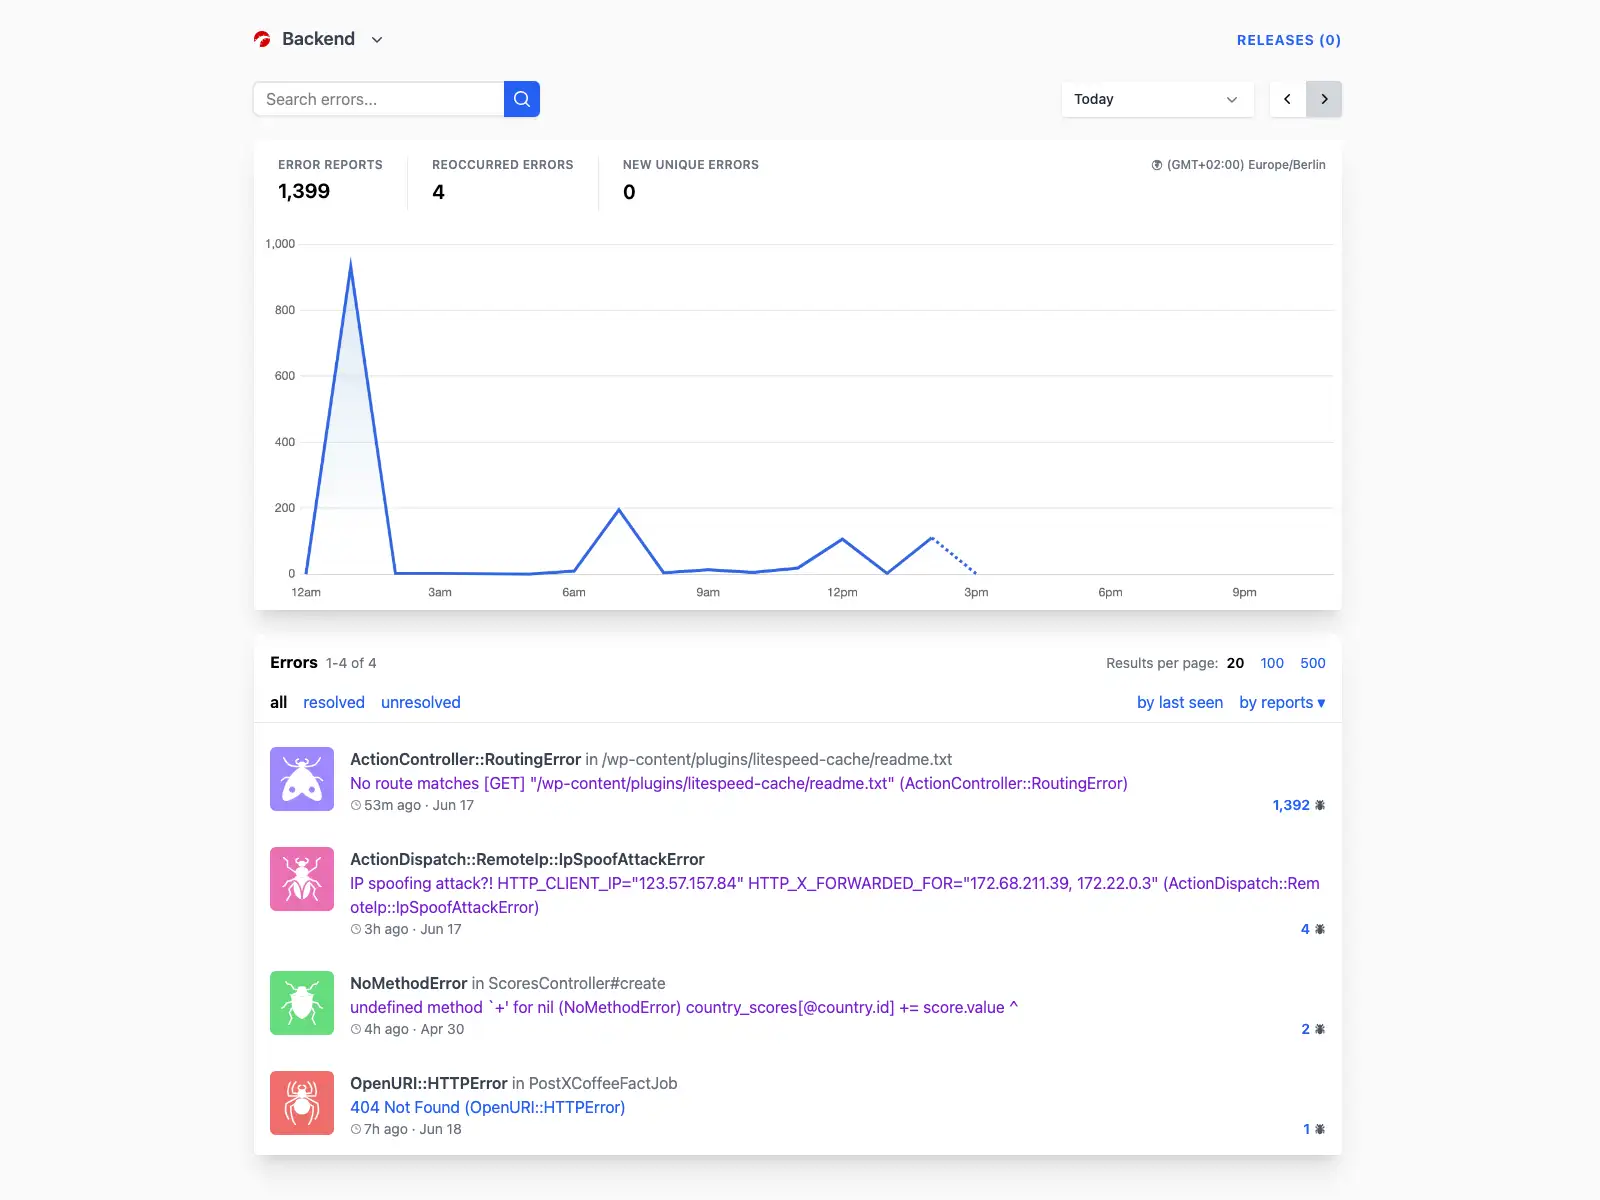
Click into a project, and you’re in the command center: a dynamic dashboard tailored for deep dives into your errors. This is where the real action happens — spotting patterns, resolving issues, and keeping your app humming.
Key features at a glance:
- Project picker: Dropdown in the top-left to switch projects or jump to settings. Super handy for multi-project users.
- Releases link: Quick access to your project’s release history.
- Search bar: Hunt for specific errors by message, type, or details. Results update live as you type.
- Date range selector: Filter errors by time (today, last week, etc.) with a pager for navigation.
- Stats overview: At-a-glance metrics like total reports, reoccurred vs. new errors.
- Interactive chart: Visualizes error volume over time — zoom in on spikes for clues.
- Error list: Each unique error is grouped, showing type, message, timestamp, and report count. Click for details.
- Filters: Toggle between all, resolved, or unresolved errors; sort by last seen or count.
If your project is error-free (lucky you!), you’ll see SDK setup instructions instead. Once reports flow in, the dashboard auto-refreshes with real data — no manual reloads needed.
Quick tip: Use the search and filters to triage fast — focus on unresolved high-volume errors first. The chart is your trend-spotter; watch for patterns tied to deploys or traffic surges.