15.1.2 Backtrace 
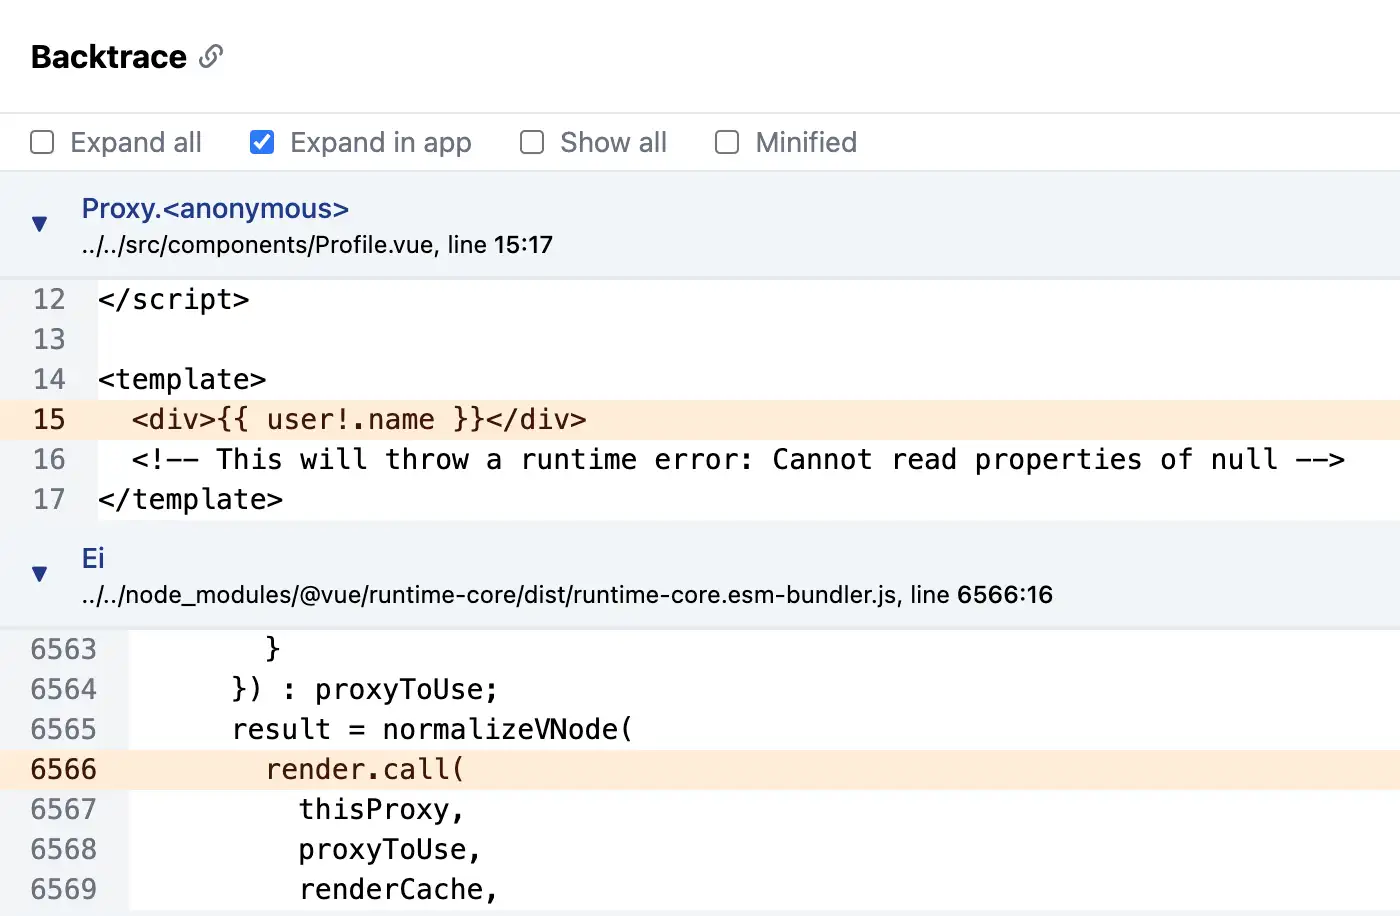
The Backtrace section displays the backtrace leading to the error, which is crucial for pinpointing the exact location in code where the issue arose. Each frame includes:
- Filename: The file where the code executed.
- Function: The method or function name.
- Line number: The specific line in the file, with optional column number.
Code snippets from the relevant lines are shown, with the error line highlighted in orange for emphasis. If source maps are applied (for minified code), both original and minified views are available. Frames can be expanded to show pre- and post-context lines of code.
This corresponds to Sentry’s exception or threads interface, which
captures the call stack. It supports features like "in-app" frames to
distinguish application code from dependencies.
To verify, expand frames and check if the highlighted line matches the error description.